Obiettivi
Questo tutorial ha lo scopo di introdurre solo il pacchetto pepe, utilizzando un case study. Lo scopo di questo pacchetto è di presentare le tabelle ei grafici con facilità.
Dataset
Dopo aver pulito il set di dati (sample_data) per questo
case study, possiamo visualizzare le statistiche riassuntive dei dati
forniti.
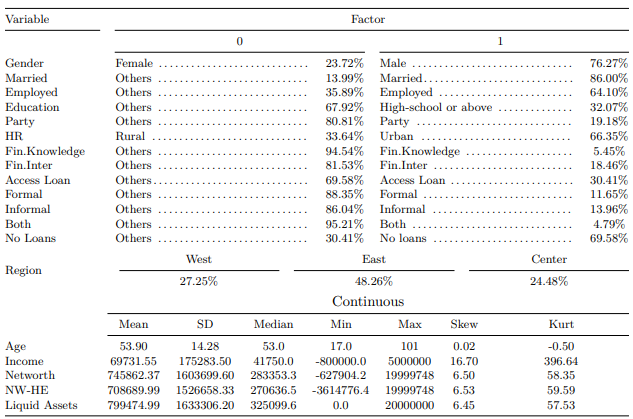
Nota: HR sta per Household Registration. NW-HE è il patrimonio netto meno il patrimonio immobiliare. Tutte le variabili dell’asset (ad es. reddito, patrimonio netto, NW-HE e attività liquide sono in renminbi cinese (CNY).
Overview
Il pacchetto pepe esegue Plot.by.Factr,
df4.Plot.by.Factr e Pvot.by.Factr.
Questo pacchetto è utile quando è
necessario eseguire statistiche descrittive e tracciare grafici per
diverse suddivisioni di dati.
Building plots
Plotting
La funzione Plot.by.Factr creerà il tracciato con due
variabili fattore di livello (var).
df <- sample_data[c("Formal","Informal","L.Both","No.Loan",
"sex","educ","political.afl","married",
 "havejob","rural","age","Income","Networth","Liquid.Assets",
 "NW.HE","fin.knowldge","fin.intermdiaries")]
 CN = colnames(df)
 var <- c("educ","rural","sex","havejob","political.afl")
 name.levels = c("Formal","Informal","L.Both","No.Loan",
 "sex","educ","political.afl","married",
 "havejob","rural","age","Income","Networth","Liquid.Assets",
 "NW.HE","fin.knowldge","fin.intermdiaries")

XXX <- df4.Plot.by.Factr(var,df)$Summ.Stats.long
Plot.by.Factr(XXX, name.levels)
#> Selecting by Mean
#> Joining with `by = join_by(Variable, Mean)`
#> Warning in scale_x_log10(): log-10 transformation introduced infinite values.
#> log-10 transformation introduced infinite values.
#> Selecting by Mean
#> Joining with `by = join_by(Variable, Mean)`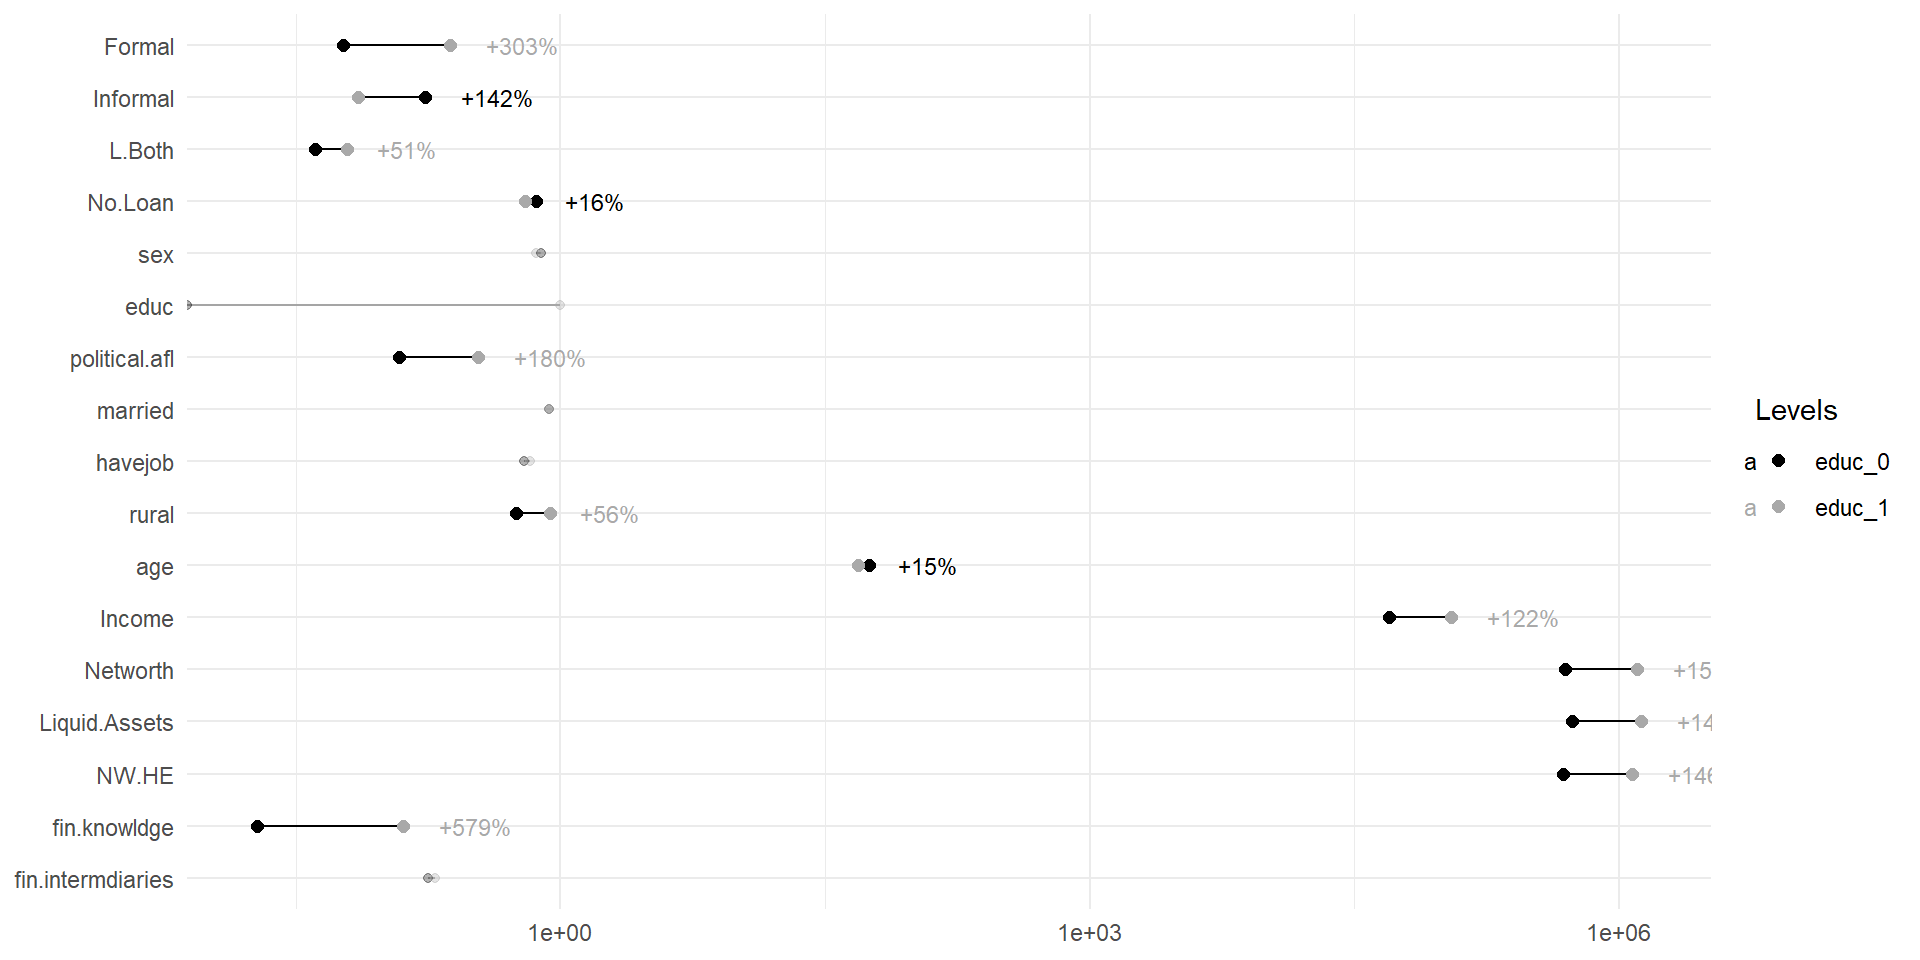
#> Warning in scale_x_log10(): log-10 transformation introduced infinite values.
#> log-10 transformation introduced infinite values.
#> Selecting by Mean
#> Joining with `by = join_by(Variable, Mean)`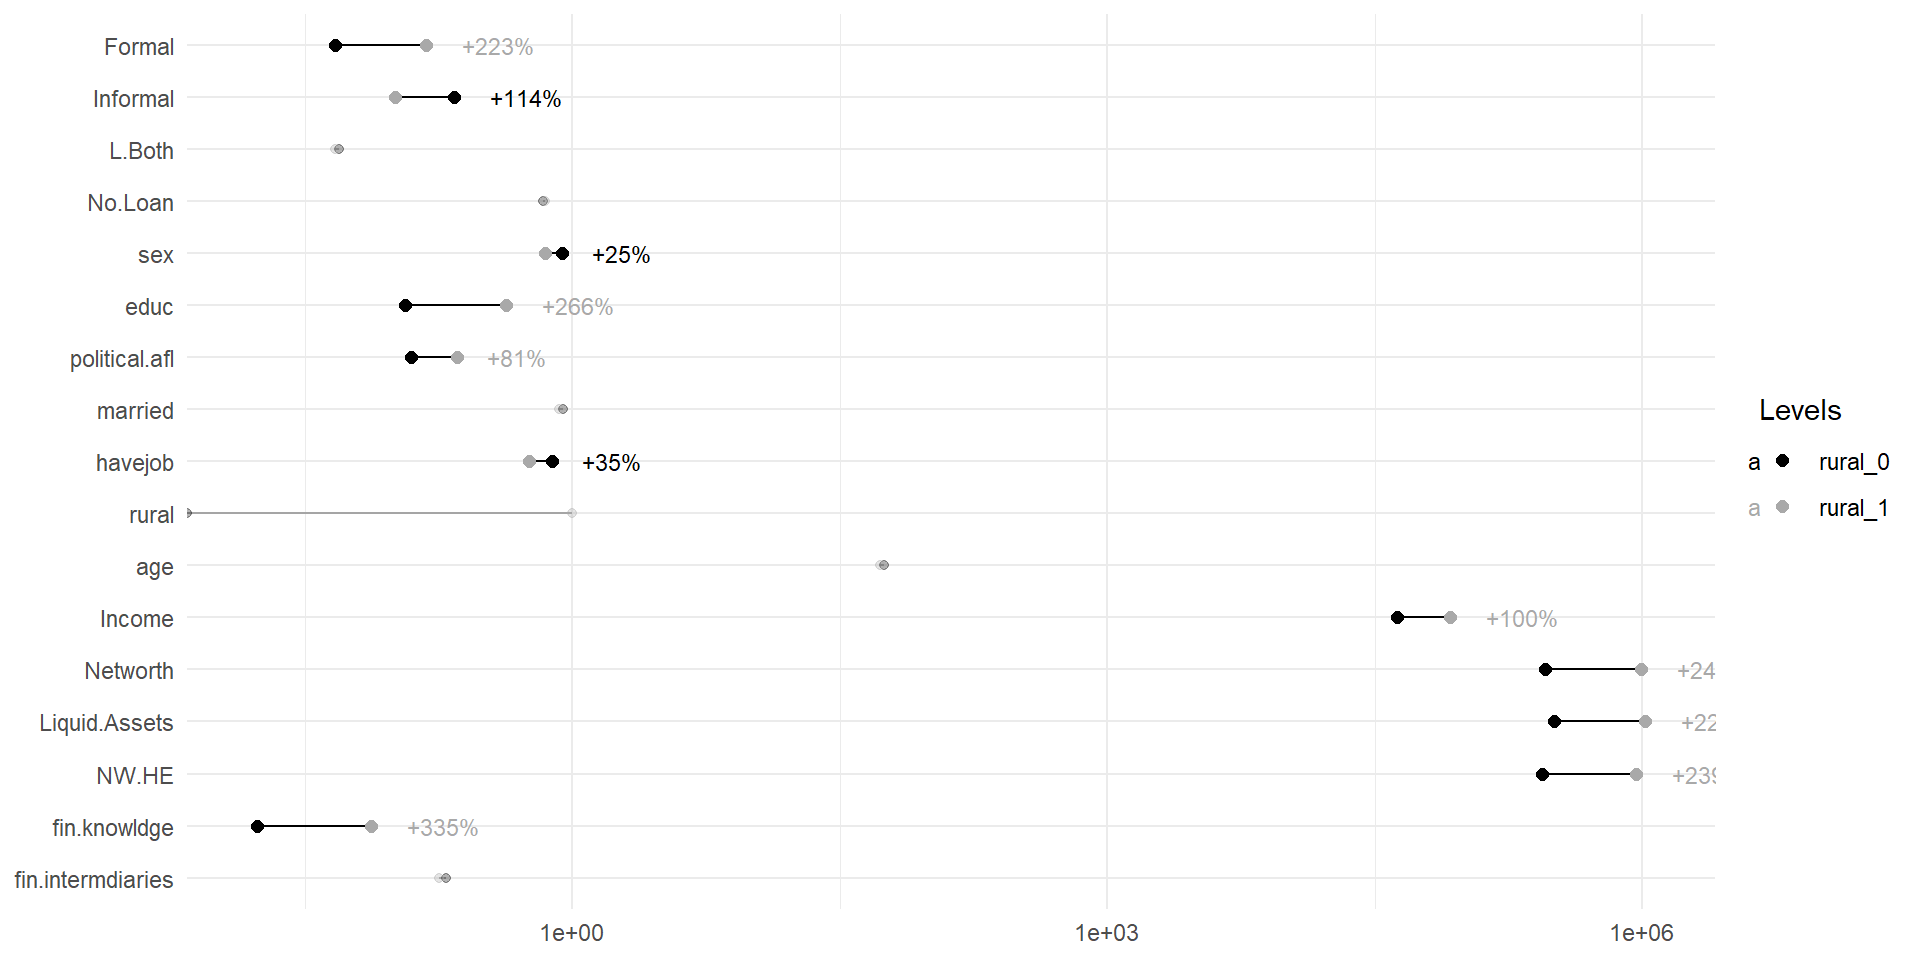
#> Warning in scale_x_log10(): log-10 transformation introduced infinite values.
#> log-10 transformation introduced infinite values.
#> Selecting by Mean
#> Joining with `by = join_by(Variable, Mean)`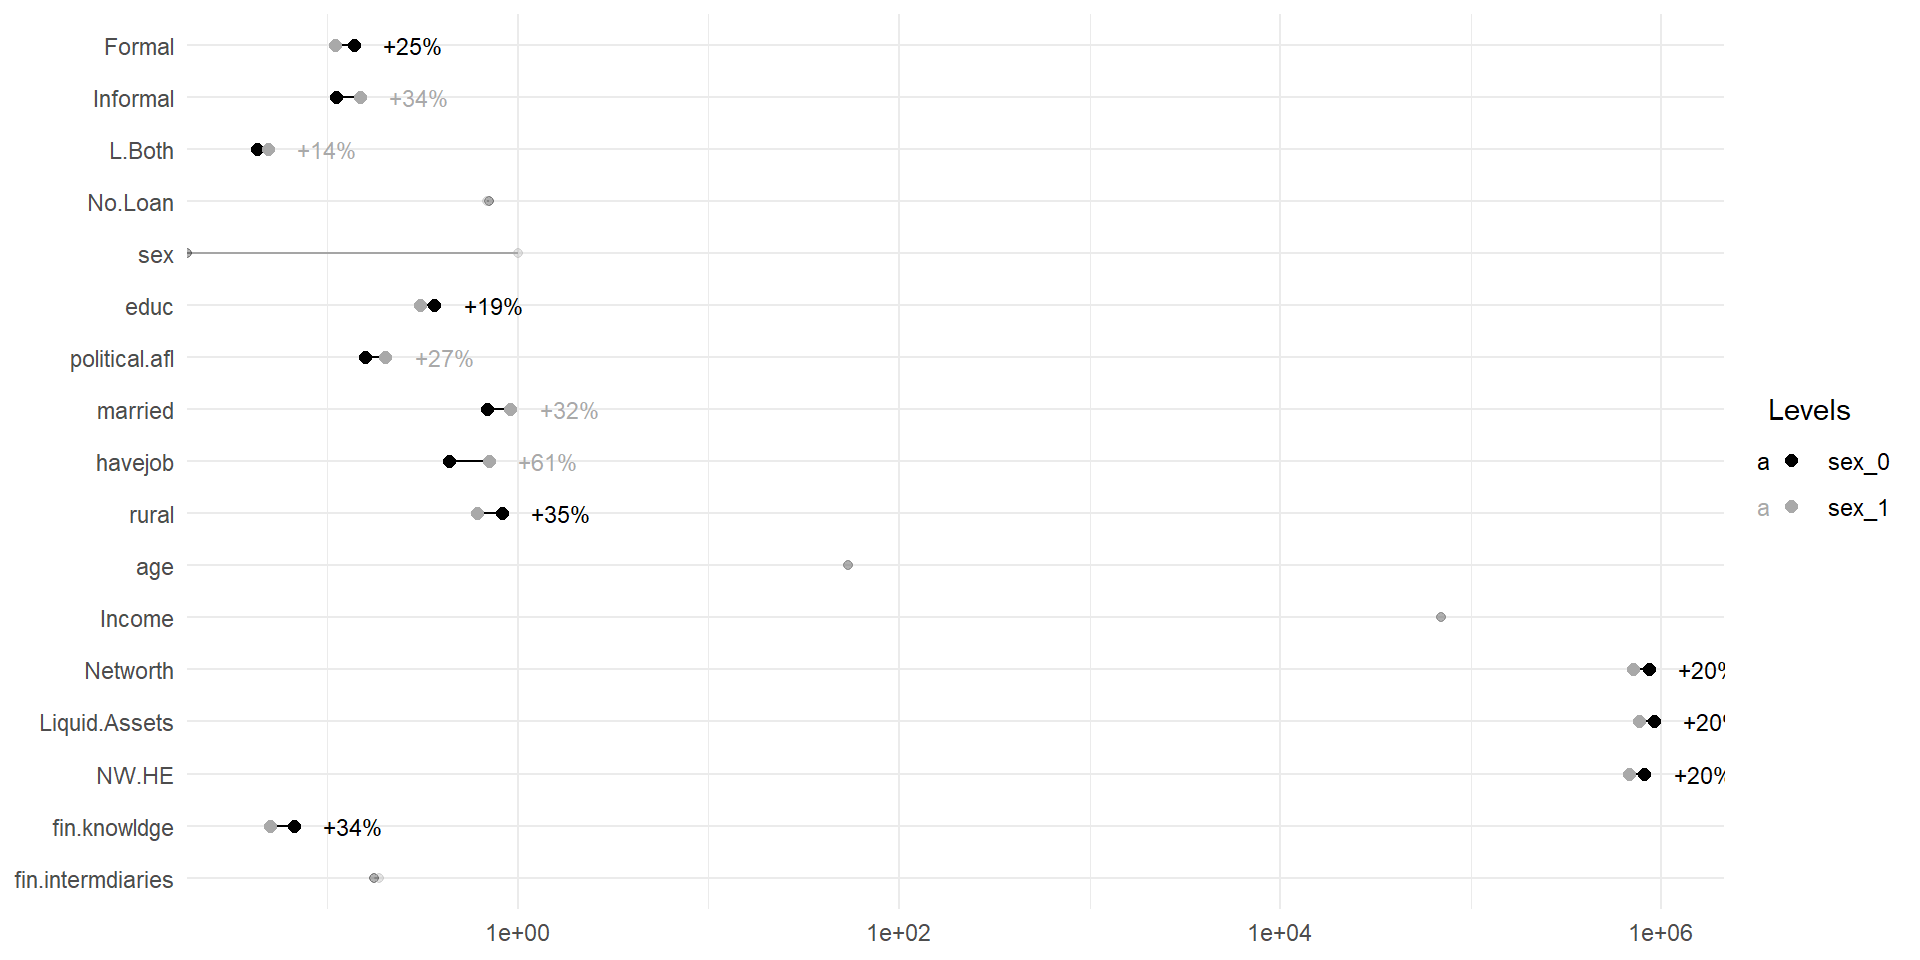
#> Warning in scale_x_log10(): log-10 transformation introduced infinite values.
#> log-10 transformation introduced infinite values.
#> Selecting by Mean
#> Joining with `by = join_by(Variable, Mean)`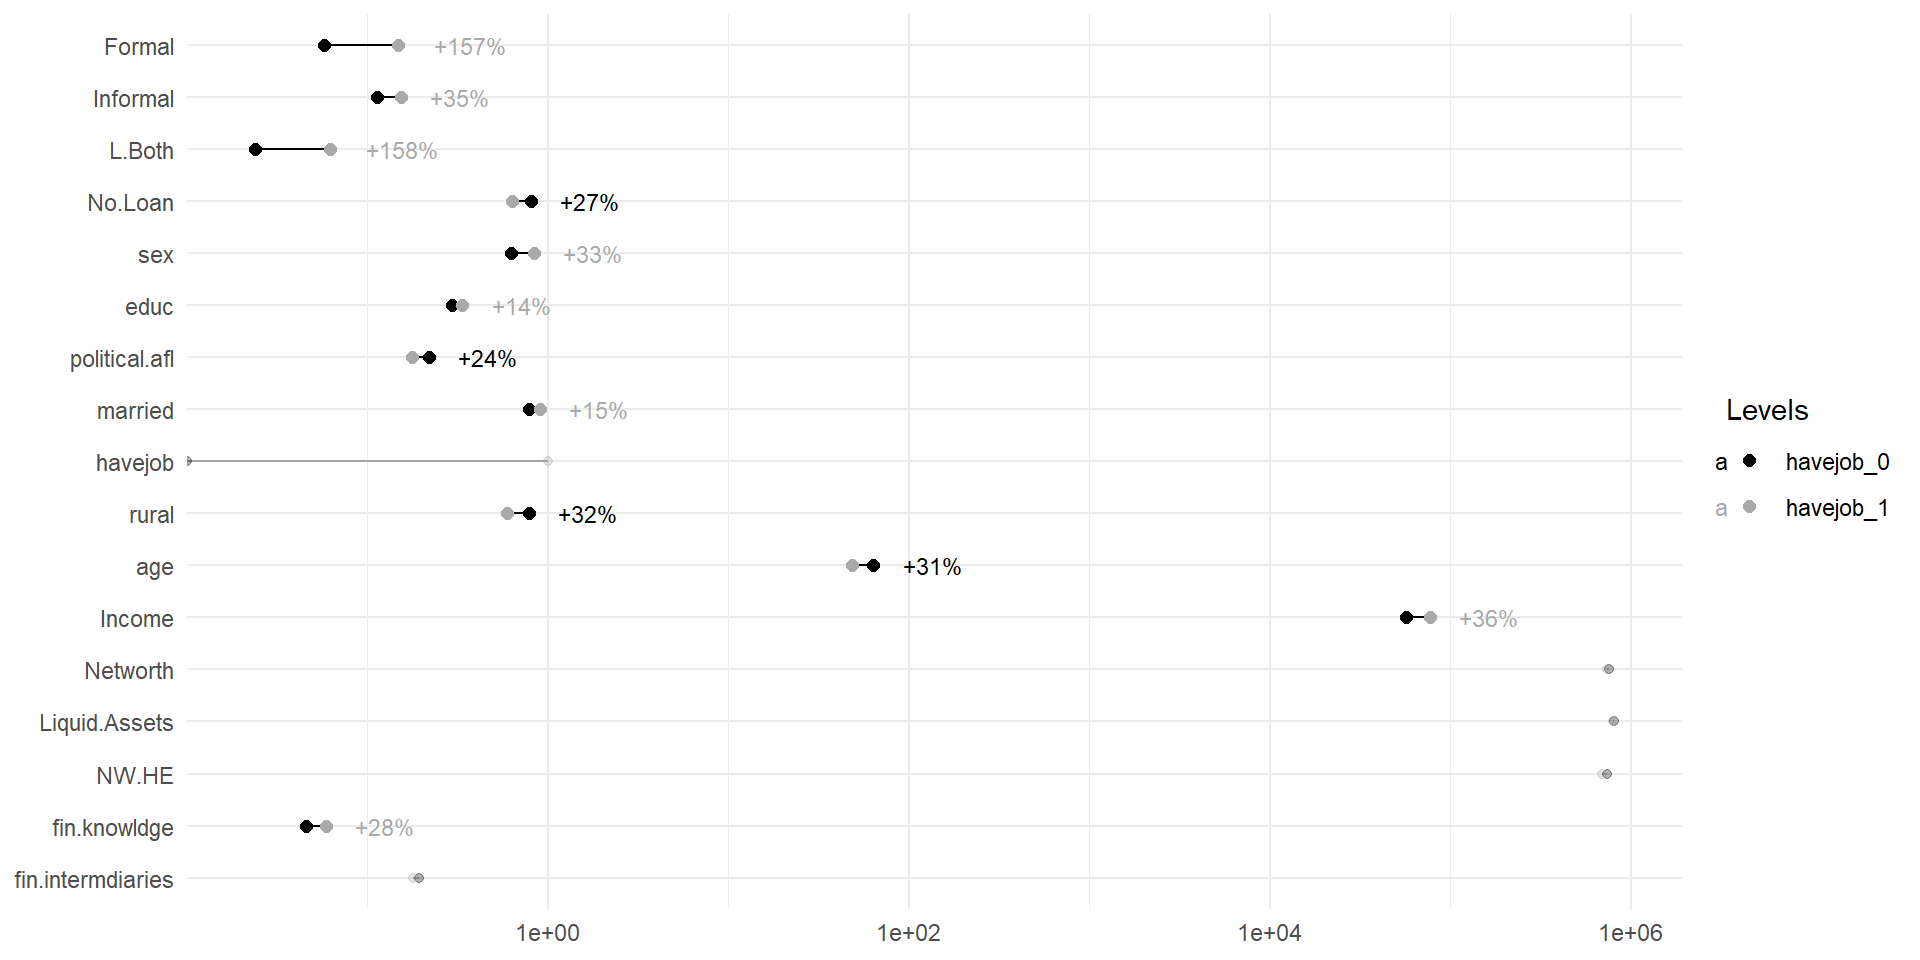
#> Warning in scale_x_log10(): log-10 transformation introduced infinite values.
#> log-10 transformation introduced infinite values.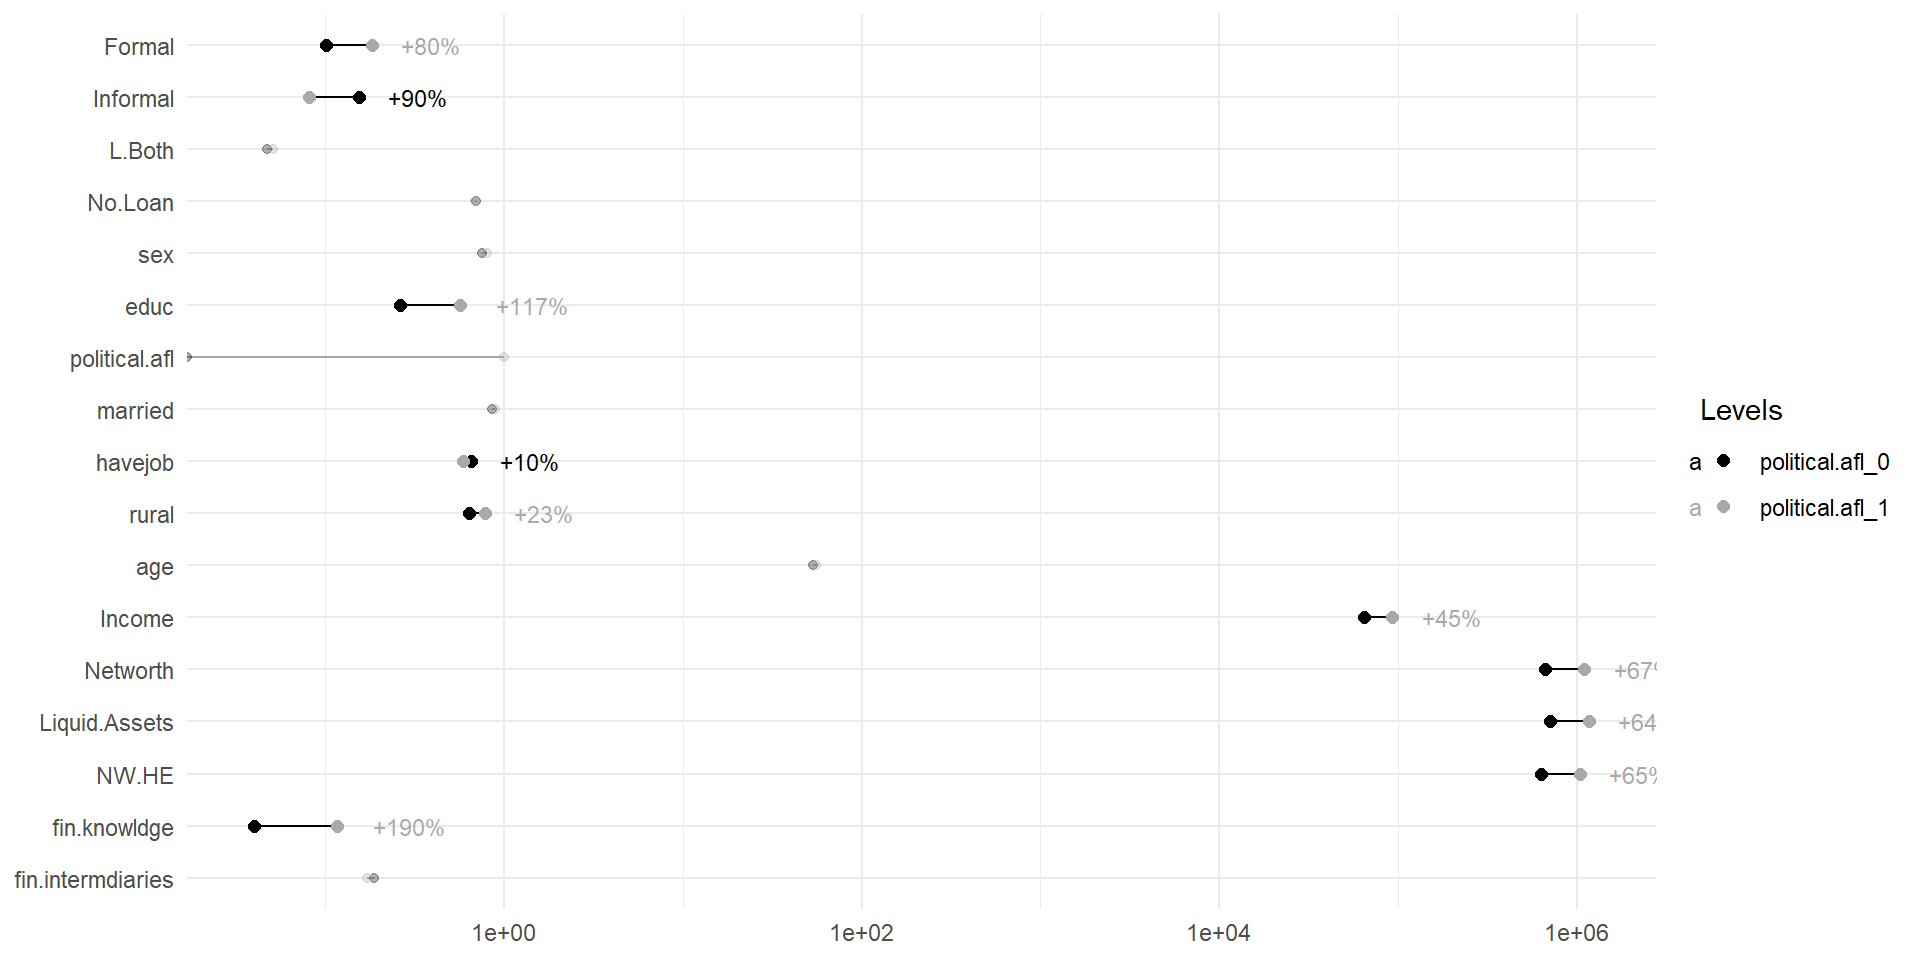
Building tables
Summary statistics
La funzione df4.Plot.by.Factr creerà statistiche di
gruppo.
df4.Plot.by.Factr(var,df)
#> $Summ.Stats
#> $Summ.Stats[[1]]
#> educ_0 educ_1 educ_diff
#> age 56.233 48.944 7.289
#> Income 50112.134 111281.618 61169.485
#> Networth 498209.669 1270342.194 772132.524
#> Liquid.Assets 542379.811 1343952.158 801572.347
#> NW.HE 482692.708 1187307.896 704615.189
#> Formal 0.059 0.238 0.179
#> Informal 0.172 0.071 0.101
#> L.Both 0.041 0.062 0.020
#> No.Loan 0.727 0.629 0.098
#> sex 0.778 0.730 0.049
#> educ 0.000 1.000 1.000
#> political.afl 0.122 0.341 0.219
#> married 0.859 0.861 0.002
#> havejob 0.627 0.671 0.044
#> rural 0.562 0.879 0.317
#> fin.knowldge 0.019 0.129 0.110
#> fin.intermdiaries 0.179 0.196 0.017
#>
#> $Summ.Stats[[2]]
#> rural_0 rural_1 rural_diff
#> age 55.830 52.914 2.917
#> Income 41979.507 83801.586 41822.079
#> Networth 283621.530 980214.349 696592.819
#> Liquid.Assets 320888.314 1042114.177 721225.863
#> NW.HE 274315.470 928913.998 654598.528
#> Formal 0.047 0.152 0.104
#> Informal 0.216 0.101 0.114
#> L.Both 0.049 0.047 0.002
#> No.Loan 0.688 0.700 0.012
#> sex 0.878 0.704 0.174
#> educ 0.116 0.425 0.309
#> political.afl 0.125 0.226 0.100
#> married 0.886 0.847 0.039
#> havejob 0.773 0.574 0.198
#> rural 0.000 1.000 1.000
#> fin.knowldge 0.017 0.074 0.057
#> fin.intermdiaries 0.195 0.180 0.015
#>
#> $Summ.Stats[[3]]
#> sex_0 sex_1 sex_diff
#> age 54.226 53.792 0.434
#> Income 69848.240 69695.249 152.991
#> Networth 856991.073 711293.342 145697.731
#> Liquid.Assets 913497.514 764005.787 149491.727
#> NW.HE 813350.902 676132.915 137217.987
#> Formal 0.138 0.110 0.028
#> Informal 0.111 0.149 0.038
#> L.Both 0.043 0.049 0.007
#> No.Loan 0.709 0.692 0.017
#> sex 0.000 1.000 1.000
#> educ 0.366 0.307 0.059
#> political.afl 0.159 0.202 0.043
#> married 0.691 0.913 0.222
#> havejob 0.438 0.704 0.266
#> rural 0.828 0.613 0.215
#> fin.knowldge 0.067 0.050 0.017
#> fin.intermdiaries 0.176 0.187 0.011
#>
#> $Summ.Stats[[4]]
#> havejob_0 havejob_1 havejob_diff
#> age 63.576 48.475 15.101
#> Income 56781.006 76982.126 20201.120
#> Networth 757974.392 739081.250 18893.142
#> Liquid.Assets 805614.836 796037.507 9577.329
#> NW.HE 742160.748 689950.830 52209.918
#> Formal 0.058 0.149 0.092
#> Informal 0.114 0.154 0.040
#> L.Both 0.024 0.062 0.038
#> No.Loan 0.804 0.635 0.169
#> sex 0.628 0.838 0.210
#> educ 0.294 0.336 0.041
#> political.afl 0.219 0.177 0.042
#> married 0.784 0.903 0.119
#> havejob 0.000 1.000 1.000
#> rural 0.787 0.595 0.192
#> fin.knowldge 0.046 0.059 0.013
#> fin.intermdiaries 0.195 0.179 0.017
#>
#> $Summ.Stats[[5]]
#> political.afl_0 political.afl_1 political.afl_diff
#> age 53.461 55.724 2.263
#> Income 64184.651 93097.169 28912.518
#> Networth 661085.850 1102973.001 441887.150
#> Liquid.Assets 711676.724 1169314.401 457637.677
#> NW.HE 630009.072 1040123.664 410114.592
#> Formal 0.101 0.182 0.081
#> Informal 0.154 0.081 0.073
#> L.Both 0.047 0.051 0.004
#> No.Loan 0.698 0.686 0.013
#> sex 0.753 0.803 0.050
#> educ 0.262 0.569 0.308
#> political.afl 0.000 1.000 1.000
#> married 0.852 0.894 0.042
#> havejob 0.653 0.591 0.063
#> rural 0.636 0.780 0.145
#> fin.knowldge 0.040 0.116 0.076
#> fin.intermdiaries 0.188 0.171 0.017
#>
#>
#> $Summ.Stats.long
#> $Summ.Stats.long[[1]]
#> Diff Levels Mean Variable
#> 1 7.289 educ_0 56.233 age
#> 2 61169.485 educ_0 50112.134 Income
#> 3 772132.524 educ_0 498209.669 Networth
#> 4 801572.347 educ_0 542379.811 Liquid.Assets
#> 5 704615.189 educ_0 482692.708 NW.HE
#> 6 0.179 educ_0 0.059 Formal
#> 7 0.101 educ_0 0.172 Informal
#> 8 0.020 educ_0 0.041 L.Both
#> 9 0.098 educ_0 0.727 No.Loan
#> 10 0.049 educ_0 0.778 sex
#> 11 1.000 educ_0 0.000 educ
#> 12 0.219 educ_0 0.122 political.afl
#> 13 0.002 educ_0 0.859 married
#> 14 0.044 educ_0 0.627 havejob
#> 15 0.317 educ_0 0.562 rural
#> 16 0.110 educ_0 0.019 fin.knowldge
#> 17 0.017 educ_0 0.179 fin.intermdiaries
#> 18 7.289 educ_1 48.944 age
#> 19 61169.485 educ_1 111281.618 Income
#> 20 772132.524 educ_1 1270342.194 Networth
#> 21 801572.347 educ_1 1343952.158 Liquid.Assets
#> 22 704615.189 educ_1 1187307.896 NW.HE
#> 23 0.179 educ_1 0.238 Formal
#> 24 0.101 educ_1 0.071 Informal
#> 25 0.020 educ_1 0.062 L.Both
#> 26 0.098 educ_1 0.629 No.Loan
#> 27 0.049 educ_1 0.730 sex
#> 28 1.000 educ_1 1.000 educ
#> 29 0.219 educ_1 0.341 political.afl
#> 30 0.002 educ_1 0.861 married
#> 31 0.044 educ_1 0.671 havejob
#> 32 0.317 educ_1 0.879 rural
#> 33 0.110 educ_1 0.129 fin.knowldge
#> 34 0.017 educ_1 0.196 fin.intermdiaries
#>
#> $Summ.Stats.long[[2]]
#> Diff Levels Mean Variable
#> 1 2.917 rural_0 55.830 age
#> 2 41822.079 rural_0 41979.507 Income
#> 3 696592.819 rural_0 283621.530 Networth
#> 4 721225.863 rural_0 320888.314 Liquid.Assets
#> 5 654598.528 rural_0 274315.470 NW.HE
#> 6 0.104 rural_0 0.047 Formal
#> 7 0.114 rural_0 0.216 Informal
#> 8 0.002 rural_0 0.049 L.Both
#> 9 0.012 rural_0 0.688 No.Loan
#> 10 0.174 rural_0 0.878 sex
#> 11 0.309 rural_0 0.116 educ
#> 12 0.100 rural_0 0.125 political.afl
#> 13 0.039 rural_0 0.886 married
#> 14 0.198 rural_0 0.773 havejob
#> 15 1.000 rural_0 0.000 rural
#> 16 0.057 rural_0 0.017 fin.knowldge
#> 17 0.015 rural_0 0.195 fin.intermdiaries
#> 18 2.917 rural_1 52.914 age
#> 19 41822.079 rural_1 83801.586 Income
#> 20 696592.819 rural_1 980214.349 Networth
#> 21 721225.863 rural_1 1042114.177 Liquid.Assets
#> 22 654598.528 rural_1 928913.998 NW.HE
#> 23 0.104 rural_1 0.152 Formal
#> 24 0.114 rural_1 0.101 Informal
#> 25 0.002 rural_1 0.047 L.Both
#> 26 0.012 rural_1 0.700 No.Loan
#> 27 0.174 rural_1 0.704 sex
#> 28 0.309 rural_1 0.425 educ
#> 29 0.100 rural_1 0.226 political.afl
#> 30 0.039 rural_1 0.847 married
#> 31 0.198 rural_1 0.574 havejob
#> 32 1.000 rural_1 1.000 rural
#> 33 0.057 rural_1 0.074 fin.knowldge
#> 34 0.015 rural_1 0.180 fin.intermdiaries
#>
#> $Summ.Stats.long[[3]]
#> Diff Levels Mean Variable
#> 1 0.434 sex_0 54.226 age
#> 2 152.991 sex_0 69848.240 Income
#> 3 145697.731 sex_0 856991.073 Networth
#> 4 149491.727 sex_0 913497.514 Liquid.Assets
#> 5 137217.987 sex_0 813350.902 NW.HE
#> 6 0.028 sex_0 0.138 Formal
#> 7 0.038 sex_0 0.111 Informal
#> 8 0.007 sex_0 0.043 L.Both
#> 9 0.017 sex_0 0.709 No.Loan
#> 10 1.000 sex_0 0.000 sex
#> 11 0.059 sex_0 0.366 educ
#> 12 0.043 sex_0 0.159 political.afl
#> 13 0.222 sex_0 0.691 married
#> 14 0.266 sex_0 0.438 havejob
#> 15 0.215 sex_0 0.828 rural
#> 16 0.017 sex_0 0.067 fin.knowldge
#> 17 0.011 sex_0 0.176 fin.intermdiaries
#> 18 0.434 sex_1 53.792 age
#> 19 152.991 sex_1 69695.249 Income
#> 20 145697.731 sex_1 711293.342 Networth
#> 21 149491.727 sex_1 764005.787 Liquid.Assets
#> 22 137217.987 sex_1 676132.915 NW.HE
#> 23 0.028 sex_1 0.110 Formal
#> 24 0.038 sex_1 0.149 Informal
#> 25 0.007 sex_1 0.049 L.Both
#> 26 0.017 sex_1 0.692 No.Loan
#> 27 1.000 sex_1 1.000 sex
#> 28 0.059 sex_1 0.307 educ
#> 29 0.043 sex_1 0.202 political.afl
#> 30 0.222 sex_1 0.913 married
#> 31 0.266 sex_1 0.704 havejob
#> 32 0.215 sex_1 0.613 rural
#> 33 0.017 sex_1 0.050 fin.knowldge
#> 34 0.011 sex_1 0.187 fin.intermdiaries
#>
#> $Summ.Stats.long[[4]]
#> Diff Levels Mean Variable
#> 1 15.101 havejob_0 63.576 age
#> 2 20201.120 havejob_0 56781.006 Income
#> 3 18893.142 havejob_0 757974.392 Networth
#> 4 9577.329 havejob_0 805614.836 Liquid.Assets
#> 5 52209.918 havejob_0 742160.748 NW.HE
#> 6 0.092 havejob_0 0.058 Formal
#> 7 0.040 havejob_0 0.114 Informal
#> 8 0.038 havejob_0 0.024 L.Both
#> 9 0.169 havejob_0 0.804 No.Loan
#> 10 0.210 havejob_0 0.628 sex
#> 11 0.041 havejob_0 0.294 educ
#> 12 0.042 havejob_0 0.219 political.afl
#> 13 0.119 havejob_0 0.784 married
#> 14 1.000 havejob_0 0.000 havejob
#> 15 0.192 havejob_0 0.787 rural
#> 16 0.013 havejob_0 0.046 fin.knowldge
#> 17 0.017 havejob_0 0.195 fin.intermdiaries
#> 18 15.101 havejob_1 48.475 age
#> 19 20201.120 havejob_1 76982.126 Income
#> 20 18893.142 havejob_1 739081.250 Networth
#> 21 9577.329 havejob_1 796037.507 Liquid.Assets
#> 22 52209.918 havejob_1 689950.830 NW.HE
#> 23 0.092 havejob_1 0.149 Formal
#> 24 0.040 havejob_1 0.154 Informal
#> 25 0.038 havejob_1 0.062 L.Both
#> 26 0.169 havejob_1 0.635 No.Loan
#> 27 0.210 havejob_1 0.838 sex
#> 28 0.041 havejob_1 0.336 educ
#> 29 0.042 havejob_1 0.177 political.afl
#> 30 0.119 havejob_1 0.903 married
#> 31 1.000 havejob_1 1.000 havejob
#> 32 0.192 havejob_1 0.595 rural
#> 33 0.013 havejob_1 0.059 fin.knowldge
#> 34 0.017 havejob_1 0.179 fin.intermdiaries
#>
#> $Summ.Stats.long[[5]]
#> Diff Levels Mean Variable
#> 1 2.263 political.afl_0 53.461 age
#> 2 28912.518 political.afl_0 64184.651 Income
#> 3 441887.150 political.afl_0 661085.850 Networth
#> 4 457637.677 political.afl_0 711676.724 Liquid.Assets
#> 5 410114.592 political.afl_0 630009.072 NW.HE
#> 6 0.081 political.afl_0 0.101 Formal
#> 7 0.073 political.afl_0 0.154 Informal
#> 8 0.004 political.afl_0 0.047 L.Both
#> 9 0.013 political.afl_0 0.698 No.Loan
#> 10 0.050 political.afl_0 0.753 sex
#> 11 0.308 political.afl_0 0.262 educ
#> 12 1.000 political.afl_0 0.000 political.afl
#> 13 0.042 political.afl_0 0.852 married
#> 14 0.063 political.afl_0 0.653 havejob
#> 15 0.145 political.afl_0 0.636 rural
#> 16 0.076 political.afl_0 0.040 fin.knowldge
#> 17 0.017 political.afl_0 0.188 fin.intermdiaries
#> 18 2.263 political.afl_1 55.724 age
#> 19 28912.518 political.afl_1 93097.169 Income
#> 20 441887.150 political.afl_1 1102973.001 Networth
#> 21 457637.677 political.afl_1 1169314.401 Liquid.Assets
#> 22 410114.592 political.afl_1 1040123.664 NW.HE
#> 23 0.081 political.afl_1 0.182 Formal
#> 24 0.073 political.afl_1 0.081 Informal
#> 25 0.004 political.afl_1 0.051 L.Both
#> 26 0.013 political.afl_1 0.686 No.Loan
#> 27 0.050 political.afl_1 0.803 sex
#> 28 0.308 political.afl_1 0.569 educ
#> 29 1.000 political.afl_1 1.000 political.afl
#> 30 0.042 political.afl_1 0.894 married
#> 31 0.063 political.afl_1 0.591 havejob
#> 32 0.145 political.afl_1 0.780 rural
#> 33 0.076 political.afl_1 0.116 fin.knowldge
#> 34 0.017 political.afl_1 0.171 fin.intermdiariesPercantage table
La funzione Pvot.by.Factr creerà una tabella percentuale
delle variabili fattore selezionate.
df <- sample_data[c("multi.level",
"Formal","L.Both","No.Loan",
 "region", "sex", "educ", "political.afl",
 "married", "havejob", "rural",
 "fin.knowldge", "fin.intermdiaries")]
 Pvot.by.Factr(df)
#>                        0      1      3      2
#> multi.level       69.59% 30.41%    NA%    NA%
#> Formal            88.35% 11.65%    NA%    NA%
#> L.Both            95.21%  4.79%    NA%    NA%
#> No.Loan           30.41% 69.59%    NA%    NA%
#> region               NA% 48.26% 24.48% 27.26%
#> sex               23.73% 76.27%    NA%    NA%
#> educ              67.93% 32.07%    NA%    NA%
#> political.afl     80.81% 19.19%    NA%    NA%
#> married           13.99% 86.01%    NA%    NA%
#> havejob           35.89% 64.11%    NA%    NA%
#> rural             33.64% 66.36%    NA%    NA%
#> fin.knowldge      94.55%  5.45%    NA%    NA%
#> fin.intermdiaries 81.54% 18.46%    NA%    NA%
Divertiti!