this page is under construction
Objectives
This tutorial is meant to introduce leafletjs an open-source JavaScript library for mobile-friendly interactive maps, using a case study.
Simple Map
Get Polygon Data
Create Dummy Data
Create Five Colors For Fill
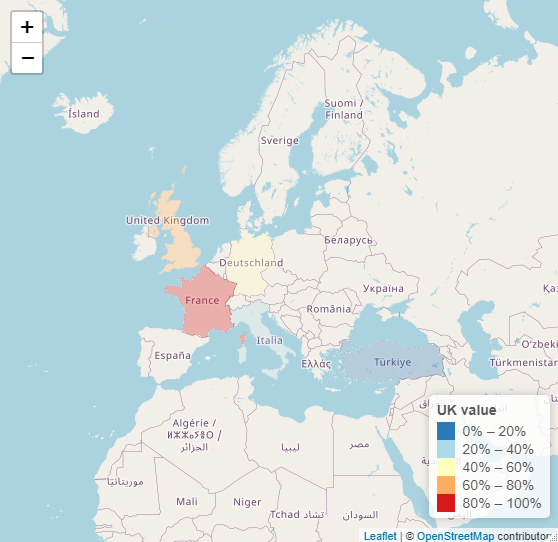
mypal <- colorQuantile(palette = "RdYlBu", domain = mydf$value, n = 5, reverse = TRUE)

leaflet() %>%
  addProviderTiles("OpenStreetMap.Mapnik") %>%
 # setView(lat = 55, lng = -3, zoom = 6) %>%
  addPolygons(data = UK,
              stroke = FALSE, smoothFactor = 0.2, fillOpacity = 0.3,
              fillColor = ~mypal(mydf$value),
              popup = paste("Region: ", UK$NAME_0, "<br>",
                            "Value: ", mydf$value, "<br>")) %>%
  addLegend(position = "bottomright", pal = mypal, values = mydf$value,
            title = "UK value",
            opacity = 1)
Simple Map