This page is under construction.
This tutorial provides a guideline for fundamental concepts in PowerBI.
DimCalendar
Date Dimension is useful for scenarios mentioned below;
- Ability to slice and dice by many date attributes (such as week number, half year, day of year, and etc.).
- Helps to calculate ‘Time Intelligence’ functions (MTD, QTD, YTD,..etc.).
- Consistency in Analysis.
Let's create the dimCalendar data flow where the Fiscal
year starts in May.
let
  YearStart = 2020,
  Source = List.Dates(#date(YearStart,1,1),365*8,#duration(1, 0, 0, 0)),
  #"Converted to table" = Table.FromList(Source, Splitter.SplitByNothing(), null, null, ExtraValues.Error),
  #"Renamed columns" = Table.RenameColumns(#"Converted to table", {{"Column1", "Date"}}),
  #"Changed column type" = Table.TransformColumnTypes(#"Renamed columns", {{"Date", type date}}),
    // sample comment
    #"Add Fiscal Year Start" = Table.AddColumn(#"Changed column type", "Fiscal Year Start", each if [Date] > Date.AddDays(#date(Date.Year([Date]),4,30), Date.DayOfWeek(#date(Date.Year([Date]),4,30),5)*-1) then
        Date.AddDays(#date(Date.Year([Date]),4,30), Date.DayOfWeek(#date(Date.Year([Date]),4,30),5)*-1+1) else
        Date.AddDays(#date(Date.Year([Date])-1,4,30), Date.DayOfWeek(#date(Date.Year([Date])-1,4,30),5)*-1+1), type date),
    ref_FiscalStartCalendar = List.Min(#"Add Fiscal Year Start"[Fiscal Year Start]),
    #"Add Fiscal Year End" = Table.AddColumn(#"Add Fiscal Year Start", "Fiscal Year End", each if [Date] > Date.AddDays(#date(Date.Year([Date]),4,30), Date.DayOfWeek(#date(Date.Year([Date]),4,30),5)*-1) then
        Date.AddDays(#date(Date.Year([Date])+1,4,30), Date.DayOfWeek(#date(Date.Year([Date])+1,4,30),5)*-1) else
        Date.AddDays(#date(Date.Year([Date]),4,30), Date.DayOfWeek(#date(Date.Year([Date]),4,30),5)*-1), type date),
    #"Add FIscal Year" = Table.AddColumn(#"Add Fiscal Year End", "Fiscal Year", each Text.Combine({"FY", Text.Range(Text.From(Date.Year([Fiscal Year End])),2,2)}), type text),
    #"Add Fiscal Weeks" = Table.AddColumn(#"Add FIscal Year", "Fiscal Weeks", each (Duration.Days([Fiscal Year End]-[Fiscal Year Start])+1)/7, Int64.Type),
    #"Add Fiscal Month 01 End 4/5" = Table.AddColumn(#"Add Fiscal Weeks", "Fiscal Month 01 End", each if [Fiscal Weeks]=53 then Date.AddDays([Fiscal Year Start],35-1) else Date.AddDays([Fiscal Year Start],28-1), type date),
    #"Add Fiscal Month 02 End 5" = Table.AddColumn(#"Add Fiscal Month 01 End 4/5", "Fiscal Month 02 End", each Date.AddDays([Fiscal Month 01 End],35), type date),
    #"Add Fiscal Month 03 End 4" = Table.AddColumn(#"Add Fiscal Month 02 End 5", "Fiscal Month 03 End", each Date.AddDays([Fiscal Month 02 End],28), type date),
    #"Add Fiscal Month 04 End 4" = Table.AddColumn(#"Add Fiscal Month 03 End 4", "Fiscal Month 04 End", each Date.AddDays([Fiscal Month 03 End],28), type date),
    #"Add Fiscal Month 05 End 5" = Table.AddColumn(#"Add Fiscal Month 04 End 4", "Fiscal Month 05 End", each Date.AddDays([Fiscal Month 04 End],35), type date),
    #"Add Fiscal Month 06 End 4" = Table.AddColumn(#"Add Fiscal Month 05 End 5", "Fiscal Month 06 End", each Date.AddDays([Fiscal Month 05 End],28), type date),
    #"Add Fiscal Month 07 End 4" = Table.AddColumn(#"Add Fiscal Month 06 End 4", "Fiscal Month 07 End", each Date.AddDays([Fiscal Month 06 End],28), type date),
    #"Add Fiscal Month 08 End 5" = Table.AddColumn(#"Add Fiscal Month 07 End 4", "Fiscal Month 08 End", each Date.AddDays([Fiscal Month 07 End],35), type date),
    #"Add Fiscal Month 09 End 4" = Table.AddColumn(#"Add Fiscal Month 08 End 5", "Fiscal Month 09 End", each Date.AddDays([Fiscal Month 08 End],28), type date),
    #"Add Fiscal Month 10 End 4" = Table.AddColumn(#"Add Fiscal Month 09 End 4", "Fiscal Month 10 End", each Date.AddDays([Fiscal Month 09 End],28), type date),
    #"Add Fiscal Month 11 End 5" = Table.AddColumn(#"Add Fiscal Month 10 End 4", "Fiscal Month 11 End", each Date.AddDays([Fiscal Month 10 End],35), type date),
    #"Add Fiscal Month 12 End 4" = Table.AddColumn(#"Add Fiscal Month 11 End 5", "Fiscal Month 12 End", each Date.AddDays([Fiscal Month 11 End],28), type date),
    #"Add Fiscal Period Num" = Table.AddColumn(#"Add Fiscal Month 12 End 4", "Fiscal Month", each if
[Date] <= [Fiscal Month 01 End] then 1 else if
[Date] <= [Fiscal Month 02 End] then 2 else if
[Date] <= [Fiscal Month 03 End] then 3 else if
[Date] <= [Fiscal Month 04 End] then 4 else if
[Date] <= [Fiscal Month 05 End] then 5 else if
[Date] <= [Fiscal Month 06 End] then 6 else if
[Date] <= [Fiscal Month 07 End] then 7 else if
[Date] <= [Fiscal Month 08 End] then 8 else if
[Date] <= [Fiscal Month 09 End] then 9 else if
[Date] <= [Fiscal Month 10 End] then 10 else if
[Date] <= [Fiscal Month 11 End] then 11 else if
[Date] <= [Fiscal Month 12 End] then 12


else null, Int64.Type),
    #"Add FY" = Table.AddColumn(#"Add Fiscal Period Num", "FY", each Date.Year([Fiscal Year End]), Int64.Type),
    #"Add Day Name" = Table.AddColumn(#"Add FY", "Day Name", each Date.DayOfWeekName([Date]), type text),
    #"Add Day" = Table.AddColumn(#"Add Day Name", "Day", each Date.Day([Date]), Int64.Type),
    #"Add Days in Month" = Table.AddColumn(#"Add Day", "Days in month", each Date.DaysInMonth([Date]), Int64.Type),
    #"Add End of Month" = Table.AddColumn(#"Add Days in Month", "End of month", each Date.EndOfMonth([Date]), type date),
    #"Add Month" = Table.AddColumn(#"Add End of Month", "Month", each Date.Month([Date]), Int64.Type),
    #"Add Fiscal Quarter Num" = Table.AddColumn(#"Add Month", "Fiscal Quarter Number", each if [Fiscal Month] <= 3 then 1 else if [Fiscal Month] <= 6 then 2 else if [Fiscal Month] <= 9 then 3 else if [Fiscal Month] <= 12 then 4 else 999, Int64.Type),
    #"Add Fiscal Quarter" = Table.AddColumn(#"Add Fiscal Quarter Num", "Fiscal Quarter", each Text.Combine({"Q", Text.From([Fiscal Quarter Number])}), type text),
    #"Add Fiscal Quarter-Year" = Table.AddColumn(#"Add Fiscal Quarter", "Fiscal Quarter-Year", each Text.Combine({[Fiscal Quarter],"-",[Fiscal Year]}), type text),
    #"Add Fiscal Month Name" = Table.AddColumn(#"Add Fiscal Quarter-Year", "Fiscal Month Name", each if [Fiscal Month]<=8 then Text.Start(Date.MonthName(#date([FY],[Fiscal Month]+4,15)),3) else Text.Start(Date.MonthName(#date([FY],[Fiscal Month]-8,15)),3), type text),
    #"Add Fiscal Month-Year" = Table.AddColumn(#"Add Fiscal Month Name", "Fiscal Month-Year", each Text.Combine({[Fiscal Month Name], [Fiscal Year]}, "-"), type text),
    #"Add Fiscal Year-Month num" = Table.AddColumn(#"Add Fiscal Month-Year", "Fiscal Year-Month num", each [FY]*100+[Fiscal Month], Int64.Type),
    #"Add Fiscal Year-Quarter num" = Table.AddColumn(#"Add Fiscal Year-Month num", "Fiscal Year-Quarter num", each [FY]*100+[Fiscal Quarter Number], Int64.Type),
    #"Add Fiscal week num" = Table.AddColumn(#"Add Fiscal Year-Quarter num", "Fiscal Week num", each Number.RoundUp(Duration.Days([Date]-Date.AddDays([Fiscal Year Start],-1))/7), Int64.Type),
  AddDayOfFiscalYear = Table.AddColumn(#"Add Fiscal week num", "Day of Fiscal Year", each Duration.Days([Date] - [Fiscal Year Start]) + 1, Int64.Type),
  AddDateOffset = Table.TransformColumnTypes(Table.AddColumn(AddDayOfFiscalYear, "Date Offset", each if DateTime.Date(DateTime.FixedLocalNow()) > [Date]
then (-1) * Duration.Days(DateTime.Date(DateTime.FixedLocalNow())-[Date]) else if DateTime.Date(DateTime.FixedLocalNow()) < [Date] then
Duration.Days([Date] - DateTime.Date(DateTime.FixedLocalNow())) else 0), {{"Date Offset", Int64.Type}}),

    fiscalWeeks =
      let
        #"Removed Other Columns" = Table.SelectColumns(AddDateOffset,{"FY", "Fiscal Week num","Date"}),
        #"Grouped Rows" = Table.Group(#"Removed Other Columns", {"FY", "Fiscal Week num"}, {{"Start of Fiscal Week", each List.Min([Date]), type nullable date}, {"End of Fiscal Week", each List.Max([Date]), type nullable date}}),
        #"Sorted Rows" = Table.Sort(#"Grouped Rows",{{"FY", Order.Ascending}, {"Fiscal Week num", Order.Ascending}}),
        #"Added Index" = Table.AddIndexColumn(#"Sorted Rows", "Sequential Fiscal Week", 1, 1, Int64.Type),
        #"Added Custom" = Table.AddColumn(#"Added Index", "Fiscal Week Offset", each Table.SelectColumns(Table.LastN(Table.SelectRows(#"Added Index", each Date.IsInPreviousNDays([Start of Fiscal Week], 7)),1),"Sequential Fiscal Week" )),
        #"Expanded Fiscal Week Offset" = Table.ExpandTableColumn(#"Added Custom", "Fiscal Week Offset", {"Sequential Fiscal Week"}, {"CurrFiscWk"}),
        #"Changed Type" = Table.TransformColumnTypes(#"Expanded Fiscal Week Offset",{{"CurrFiscWk", Int64.Type}}),
        #"Added Custom1" = Table.AddColumn(#"Changed Type", "Fiscal Week Offset", each [Sequential Fiscal Week] - [CurrFiscWk], Int64.Type),
        #"Removed Columns" = Table.RemoveColumns(#"Added Custom1",{"CurrFiscWk"})
      in
        #"Removed Columns",

    ResetCal = AddDateOffset,
    #"Merged Queries" = Table.NestedJoin(ResetCal, {"FY", "Fiscal Week num"}, fiscalWeeks, {"FY", "Fiscal Week num"}, "Add_SequentialWeek", JoinKind.LeftOuter),
    #"Expanded Add_SequentialWeek" = Table.ExpandTableColumn(#"Merged Queries", "Add_SequentialWeek", {"Start of Fiscal Week", "End of Fiscal Week", "Sequential Fiscal Week", "Fiscal Week Offset"}, {"Start of Fiscal Week", "End of Fiscal Week", "Sequential Fiscal Week", "Fiscal Week Offset"}),


    Add_SequentialWeek = Table.AddColumn(#"Expanded Add_SequentialWeek", "Sequential Week Number", each Number.RoundUp(Duration.Days([Date]-Date.AddDays(Date.AddDays(#date(YearStart-1,4,30), Date.DayOfWeek(#date(Date.Year([Date])-1,4,30),5)*-1+1),-1))/7) - Number.RoundUp(Duration.Days(#date(YearStart,1,1)-Date.AddDays(Date.AddDays(#date(YearStart-1,4,30), Date.DayOfWeek(#date(Date.Year([Date])-1,4,30),5)*-1+1),-1))/7), Int64.Type),
    Add_StartOfWeek = Table.AddColumn(Add_SequentialWeek, "Start of Week", each Date.AddDays( Date.AddDays(#date(YearStart-1,4,30), Date.DayOfWeek(#date(Date.Year([Date])-1,4,30),5)*-1+1)
    ,(-7) + 7 * Number.RoundUp(Duration.Days([Date]-Date.AddDays(Date.AddDays(#date(YearStart-1,4,30), Date.DayOfWeek(#date(Date.Year([Date])-1,4,30),5)*-1+1),-1))/7) ), type date),
    Add_EndOfWeek = Table.AddColumn(Add_StartOfWeek, "End of Week", each Date.AddDays( Date.AddDays(#date(YearStart-1,4,30), Date.DayOfWeek(#date(Date.Year([Date])-1,4,30),5)*-1+1)
    ,(-1) + 7 * Number.RoundUp(Duration.Days([Date]-Date.AddDays(Date.AddDays(#date(YearStart-1,4,30), Date.DayOfWeek(#date(Date.Year([Date])-1,4,30),5)*-1+1),-1))/7) ), type date),

    #"Add Month name" = Table.AddColumn(Add_EndOfWeek, "Month name", each Date.MonthName([Date]), type text),
    #"Changed Type" = Table.TransformColumnTypes(#"Add Month name",{{"Date", type date}, {"Fiscal Year Start", type date}, {"Fiscal Year End", type date}, {"Fiscal Month 01 End", type date}, {"Fiscal Month 02 End", type date}, {"Fiscal Month 03 End", type date}, {"Fiscal Month 04 End", type date}, {"Fiscal Month 05 End", type date}, {"Fiscal Month 06 End", type date}, {"Fiscal Month 07 End", type date}, {"Fiscal Year", type text}, {"Fiscal Weeks", Int64.Type}, {"Fiscal Month 08 End", type date}, {"Fiscal Month 09 End", type date}, {"Fiscal Month 10 End", type date}, {"Fiscal Month 11 End", type date}, {"Fiscal Month 12 End", type date}, {"Fiscal Month", Int64.Type}, {"FY", Int64.Type}, {"Day", Int64.Type}, {"Days in month", Int64.Type}, {"Day Name", type text}, {"End of month", type date}, {"Month", Int64.Type}, {"Fiscal Quarter Number", Int64.Type}, {"Fiscal Quarter", type text}, {"Fiscal Quarter-Year", type text}, {"Fiscal Month Name", type text}, {"Fiscal Month-Year", type text}, {"Month name", type text}, {"Fiscal Year-Month num", Int64.Type}, {"Fiscal Year-Quarter num", Int64.Type}, {"Fiscal Week num", Int64.Type}}),
    // code added below is from Matt Hecht on 3/22/23. Added start/end of fiscal quarters and months, with offsets to support them
  Add_Start_Of_Fiscal_mo = Table.AddColumn(#"Changed Type", "Start of Fiscal Month", each
      if [Fiscal Month] = 1 then [Fiscal Year Start] else
      if [Fiscal Month] = 2 then Date.AddDays([Fiscal Month 01 End], 1) else
      if [Fiscal Month] = 3 then Date.AddDays([Fiscal Month 02 End], 1) else
      if [Fiscal Month] = 4 then Date.AddDays([Fiscal Month 03 End], 1) else
      if [Fiscal Month] = 5 then Date.AddDays([Fiscal Month 04 End], 1) else
      if [Fiscal Month] = 6 then Date.AddDays([Fiscal Month 05 End], 1) else
      if [Fiscal Month] = 7 then Date.AddDays([Fiscal Month 06 End], 1) else
      if [Fiscal Month] = 8 then Date.AddDays([Fiscal Month 07 End], 1) else
      if [Fiscal Month] = 9 then Date.AddDays([Fiscal Month 08 End], 1) else
      if [Fiscal Month] = 10 then Date.AddDays([Fiscal Month 09 End], 1) else
      if [Fiscal Month] = 11 then Date.AddDays([Fiscal Month 10 End], 1) else
      if [Fiscal Month] = 12 then Date.AddDays([Fiscal Month 11 End], 1) else
      null, type date ),
    Add_End_Of_Fiscal_mo = Table.AddColumn(Add_Start_Of_Fiscal_mo, "End of Fiscal Month", each
      if [Fiscal Month] = 1 then [Fiscal Month 01 End] else
      if [Fiscal Month] = 2 then [Fiscal Month 02 End] else
      if [Fiscal Month] = 3 then [Fiscal Month 03 End] else
      if [Fiscal Month] = 4 then [Fiscal Month 04 End] else
      if [Fiscal Month] = 5 then [Fiscal Month 05 End] else
      if [Fiscal Month] = 6 then [Fiscal Month 06 End] else
      if [Fiscal Month] = 7 then [Fiscal Month 07 End] else
      if [Fiscal Month] = 8 then [Fiscal Month 08 End] else
      if [Fiscal Month] = 9 then [Fiscal Month 09 End] else
      if [Fiscal Month] = 10 then [Fiscal Month 10 End] else
      if [Fiscal Month] = 11 then [Fiscal Month 11 End] else
      if [Fiscal Month] = 12 then [Fiscal Month 12 End] else
      null, type date ),
  CurrDt_Index = if List.Max( Add_Start_Of_Fiscal_mo[Date] ) > DateTime.Date(DateTime.FixedLocalNow()) then DateTime.Date(DateTime.FixedLocalNow()) else Date.AddDays( List.Max( Add_Start_Of_Fiscal_mo[Date] ), -1 ),
  CurrDt_Start_Fmo_Index = Record.Field(Table.Min(Table.Buffer(Table.SelectRows( Add_End_Of_Fiscal_mo, each [End of Fiscal Month] > CurrDt_Index ) ), "Start of Fiscal Month"), "Start of Fiscal Month"),
  Add_Fiscal_Month_Offset = Table.AddColumn(Add_End_Of_Fiscal_mo, "Fiscal Month Offset", each Number.Round(Number.From( [Start of Fiscal Month] - CurrDt_Start_Fmo_Index)/ 30,0), Int64.Type),
    Add_Start_Of_Fiscal_Qtr = Table.AddColumn(Add_Fiscal_Month_Offset, "Start of Fiscal Quarter", each
      if [Fiscal Month] = 1 then [Fiscal Year Start] else
      if [Fiscal Month] = 2 then [Fiscal Year Start] else
      if [Fiscal Month] = 3 then [Fiscal Year Start] else
      if [Fiscal Month] = 4 then Date.AddDays([Fiscal Month 03 End], 1) else
      if [Fiscal Month] = 5 then Date.AddDays([Fiscal Month 03 End], 1) else
      if [Fiscal Month] = 6 then Date.AddDays([Fiscal Month 03 End], 1) else
      if [Fiscal Month] = 7 then Date.AddDays([Fiscal Month 06 End], 1) else
      if [Fiscal Month] = 8 then Date.AddDays([Fiscal Month 06 End], 1) else
      if [Fiscal Month] = 9 then Date.AddDays([Fiscal Month 06 End], 1) else
      if [Fiscal Month] = 10 then Date.AddDays([Fiscal Month 09 End], 1) else
      if [Fiscal Month] = 11 then Date.AddDays([Fiscal Month 09 End], 1) else
      if [Fiscal Month] = 12 then Date.AddDays([Fiscal Month 09 End], 1) else
      null, type date ),
    Add_End_Of_Fiscal_Qtr = Table.AddColumn(Add_Start_Of_Fiscal_Qtr, "End of Fiscal Quarter", each
      if [Fiscal Month] = 1 then [Fiscal Month 03 End] else
      if [Fiscal Month] = 2 then [Fiscal Month 03 End] else
      if [Fiscal Month] = 3 then [Fiscal Month 03 End] else
      if [Fiscal Month] = 4 then [Fiscal Month 06 End] else
      if [Fiscal Month] = 5 then [Fiscal Month 06 End] else
      if [Fiscal Month] = 6 then [Fiscal Month 06 End] else
      if [Fiscal Month] = 7 then [Fiscal Month 09 End] else
      if [Fiscal Month] = 8 then [Fiscal Month 09 End] else
      if [Fiscal Month] = 9 then [Fiscal Month 09 End] else
      if [Fiscal Month] = 10 then [Fiscal Month 12 End] else
      if [Fiscal Month] = 11 then [Fiscal Month 12 End] else
      if [Fiscal Month] = 12 then [Fiscal Month 12 End] else
      null, type date ),
    CurrDt_Start_Fqtr_Index = Record.Field(Table.Min(Table.Buffer(Table.SelectRows( Add_End_Of_Fiscal_Qtr, each [End of Fiscal Quarter] > CurrDt_Index ) ), "Start of Fiscal Quarter"), "Start of Fiscal Quarter"),
    CurrDt_Start_Fyr_Index = Record.Field(Table.Min(Table.Buffer(Table.SelectRows( Add_End_Of_Fiscal_Qtr, each [Fiscal Year End] > CurrDt_Index ) ), "Fiscal Year Start"), "Fiscal Year Start"),
    Add_Fiscal_Qtr_Offset = Table.AddColumn(Add_End_Of_Fiscal_Qtr, "Fiscal Quarter Offset", each Number.Round(Number.From( [Start of Fiscal Quarter] - CurrDt_Start_Fqtr_Index)/ 90,0), Int64.Type),
  #"Added custom 1" = Table.TransformColumnTypes(Table.AddColumn(Add_Fiscal_Qtr_Offset, "Fiscal Year Offset", each Number.Round(Number.From( [Fiscal Year Start] - CurrDt_Start_Fyr_Index)/ 365,0)), {{"Fiscal Year Offset", Int64.Type}}),
  #"Inserted prefix" = Table.AddColumn(#"Added custom 1", "Fiscal YR", each "FY" & Text.From([FY]), type text),
  #"Added custom" = Table.AddColumn(#"Inserted prefix", "Fiscal Yr-Wk", each [Fiscal Year] & "-" & Text.From([Fiscal Week num]), type text),
  AddDayOfFiscalMonth = Table.TransformColumnTypes(Table.AddColumn(#"Added custom", "Day of Fiscal Month", each Duration.Days([Date] - [Start of Fiscal Month]) + 1), {{"Day of Fiscal Month", Int64.Type}}),
  AddDayOfFiscalQuarter = Table.TransformColumnTypes(Table.AddColumn(AddDayOfFiscalMonth, "Day of Fiscal Quarter", each Duration.Days([Date]-[Start of Fiscal Quarter]) + 1), {{"Day of Fiscal Quarter", Int64.Type}}),
  AddMonthOfFiscalQuarter = Table.TransformColumnTypes(Table.AddColumn(AddDayOfFiscalQuarter, "Month Of Fiscal Quarter", each Number.Round( Duration.Days([Start of Fiscal Month]-[Start of Fiscal Quarter])/30, 0 ) + 1), {{"Month Of Fiscal Quarter", Int64.Type}}),
  AddPeriodNo = Table.TransformColumnTypes(Table.AddColumn(AddMonthOfFiscalQuarter, "Fiscal Period", each Text.PadStart(Text.From([Fiscal Month]),3,"0")), {{"Fiscal Period", type text}}),
  AddSeqFiscalYear = Table.TransformColumnTypes(Table.AddColumn(AddPeriodNo, "Sequential Fiscal Year", each 1 + Number.Round(Number.From([Fiscal Year Start] - ref_FiscalStartCalendar) / 365 , 0)), {{"Sequential Fiscal Year", Int64.Type}}),
  AddSeqFiscalQtr = Table.TransformColumnTypes(Table.AddColumn(AddSeqFiscalYear, "Sequential Fiscal Quarter", each -1 + Number.Round(Number.From([Start of Fiscal Quarter] - ref_FiscalStartCalendar) / 90 , 0)), {{"Sequential Fiscal Quarter", Int64.Type}}),
  AddSeqFiscalMonth = Table.TransformColumnTypes(Table.AddColumn(AddSeqFiscalQtr, "Sequential Fiscal Month", each -7 + Number.Round(Number.From([Start of Fiscal Month] - ref_FiscalStartCalendar) / 30 , 0)), {{"Sequential Fiscal Month", Int64.Type}}),
  AddFiscWeekOfQtr = Table.TransformColumnTypes(Table.AddColumn(AddSeqFiscalMonth, "Week of Fiscal Quarter Num", each 1 + Number.Round( Number.From([Start of Fiscal Week] - [Start of Fiscal Quarter]) / 7, 0 )), {{"Week of Fiscal Quarter Num", Int64.Type}}),
  AddWkOfFiscYr = Table.TransformColumnTypes(Table.AddColumn(AddFiscWeekOfQtr, "Week of Fiscal Year", each "W"&Number.ToText([Fiscal Week num])), {{"Week of Fiscal Year", type text}}),
  #"Added custom 2" = Table.TransformColumnTypes(Table.AddColumn(AddWkOfFiscYr, "Week of Fiscal Quarter", each "W"&Number.ToText([Week of Fiscal Quarter Num])), {{"Week of Fiscal Quarter", type text}}),
  #"Added Custom" = Table.TransformColumnTypes(Table.AddColumn(#"Added custom 2", "WeekDaysOfMonth", each Duration.Days([End of Fiscal Month] -[End of Fiscal Week])) ,{{"WeekDaysOfMonth", Int64.Type}})
in
    #"Added Custom"
Time Intelegence in DAX
Time Intelligence functions help to compare the data,
based on the time periods (days, months, quarters, and years). These
functions, mostly used for financial and supply chain reports, compare
the earnings, gains,…etc. over time (MTD, QTD, and YTD).
Let's create a z-Time Intelligence calculation group in
Power BI model view. After setting up the group measures, mentioned
bellow, we can assign the ‘Time Intelligence’ column name as
Time Intelligence Type and set the ordinal of the measures
by moving them up or down. Lastly, let's check the ordinality of
z-Time Intelligence calculation group on the table view.
Current Year
CY = SELECTEDMEASURE()Last Year
LY =
var _currOffset = MAX( 'Calendar'[Fiscal Month Offset] )
var _offsetBegin = MIN( 'Calendar'[Fiscal Month Offset] ) - 12
var _offsetEnd = _currOffset - 12
var _currYr = MAX( 'Calendar'[Fiscal Year Offset] )
var _datesOffsetPd =
CALCULATETABLE(
    VALUES( 'Calendar'[Date] )
    , ALL( 'Calendar' )
    , 'Calendar'[Fiscal Month Offset] >= _offsetBegin &&
        'Calendar'[Fiscal Month Offset] <= _offsetEnd
)
var _rslt =
CALCULATE (
    SELECTEDMEASURE(),
    'Calendar'[Date] IN _datesOffsetPd
)
RETURN
_rslt
Current vs Last Year
CY vs LY =
var _currOffset = MAX( 'Calendar'[Sequential Fiscal Month] )
var _offsetBegin = MIN( 'Calendar'[Sequential Fiscal Month] ) - 12
var _offsetEnd = _currOffset - 12
var _cy = MAX( 'Calendar'[Fiscal Year Offset] )
var _datesOffsetPd =
CALCULATETABLE(
    VALUES( 'Calendar'[Date] )
    , ALL( 'Calendar' )
    , 'Calendar'[Sequential Fiscal Month] >= _offsetBegin &&
        'Calendar'[Sequential Fiscal Month] <= _offsetEnd
)
var _rslt =
CALCULATE (
    SELECTEDMEASURE(),
    'Calendar'[Date] IN _datesOffsetPd
)
RETURN
SELECTEDMEASURE() - _rslt
Current vs Last Year %
CY vs LY% =
var _currOffset = MAX( 'Calendar'[Sequential Fiscal Month] )
var _offsetBegin = MIN( 'Calendar'[Sequential Fiscal Month] ) - 12
var _offsetEnd = _currOffset - 12
var _cy = MAX( 'Calendar'[Fiscal Year Offset] )
var _datesOffsetPd =
CALCULATETABLE(
    VALUES( 'Calendar'[Date] )
    , ALL( 'Calendar' )
    , 'Calendar'[Sequential Fiscal Month] >= _offsetBegin &&
        'Calendar'[Sequential Fiscal Month] <= _offsetEnd
)
var _rslt =
CALCULATE (
    SELECTEDMEASURE(),
    'Calendar'[Date] IN _datesOffsetPd
)
RETURN
DIVIDE( SELECTEDMEASURE() - _rslt, ABS(_rslt) )
Year to Day
YTD =
var _currFiscYr = MAX( 'Calendar'[FY] )
var _currDay = MAX( 'Calendar'[Day of Fiscal Year] )
RETURN
CALCULATE(
    SELECTEDMEASURE()
    , ALL( 'Calendar' )
    , 'Calendar'[Day of Fiscal Year] <= _currDay
    , 'Calendar'[FY] = _currFiscYr
)
Quarter to Day
QTD =
var _currFiscQtr = MAX( 'Calendar'[Sequential Fiscal Quarter] )
var _currDay = MAX( 'Calendar'[Day of Fiscal Year] )
RETURN
CALCULATE(
    SELECTEDMEASURE()
    , ALL( 'Calendar' )
    , 'Calendar'[Day of Fiscal Year] <= _currDay
    , 'Calendar'[Sequential Fiscal Quarter] = _currFiscQtr
)
Month to Day
MTD =
var _currFiscMth = MAX( 'Calendar'[Sequential Fiscal Month] )
var _currDay = MAX( 'Calendar'[Day of Fiscal Year] )
RETURN
CALCULATE(
    SELECTEDMEASURE()
    , ALL( 'Calendar' )
    , 'Calendar'[Day of Fiscal Year] <= _currDay
    , 'Calendar'[Sequential Fiscal Month] = _currFiscMth
)
Previous Quarter to Day
PQTD =
var _currFiscQtr = MAX( 'Calendar'[Sequential Fiscal Quarter] )
var _prevFiscQtr = _currFiscQtr - 1
var _dayOfFiscalQtr = MAX( 'Calendar'[Day of Fiscal Quarter] )
// likely need to errHndl cases where largest day in fiscal qtr doesn't line up right

RETURN
CALCULATE(
    SELECTEDMEASURE()
    , ALL( 'Calendar' )
    , 'Calendar'[Sequential Fiscal Quarter] = _prevFiscQtr
    , 'Calendar'[Day of Fiscal Quarter] <= _dayOfFiscalQtr
)
Quarter Over Quarter to Day
QOQTD =
var _cQTD =
    var _currFiscQtr = MAX( 'Calendar'[Sequential Fiscal Quarter] )
    var _currDay = MAX( 'Calendar'[Day of Fiscal Year] )
    RETURN
    CALCULATE(
        SELECTEDMEASURE()
        , ALL( 'Calendar' )
        , 'Calendar'[Day of Fiscal Year] <= _currDay
        , 'Calendar'[Sequential Fiscal Quarter] = _currFiscQtr
    )
var _pQTD =
    var _currFiscQtr = MAX( 'Calendar'[Sequential Fiscal Quarter] )
    var _prevFiscQtr = _currFiscQtr - 1
    var _dayOfFiscalQtr = MAX( 'Calendar'[Day of Fiscal Quarter] )
    // likely need to errHndl cases where largest day in fiscal qtr doesn't line up right

    RETURN
    CALCULATE(
        SELECTEDMEASURE()
        , ALL( 'Calendar' )
        , 'Calendar'[Sequential Fiscal Quarter] = _prevFiscQtr
        , 'Calendar'[Day of Fiscal Quarter] <= _dayOfFiscalQtr
    )
RETURN
    IF (
        NOT ISBLANK ( _cQTD ) && NOT ISBLANK ( _pQTD ),
        _cQTD - _pQTD
    )
Quarter Over Quarter to Day %
QOQTD % =
var _cQTD =
    var _currFiscQtr = MAX( 'Calendar'[Sequential Fiscal Quarter] )
    var _currDay = MAX( 'Calendar'[Day of Fiscal Year] )
    RETURN
    CALCULATE(
        SELECTEDMEASURE()
        , ALL( 'Calendar' )
        , 'Calendar'[Day of Fiscal Year] <= _currDay
        , 'Calendar'[Sequential Fiscal Quarter] = _currFiscQtr
    )
var _pQTD =
    var _currFiscQtr = MAX( 'Calendar'[Sequential Fiscal Quarter] )
    var _prevFiscQtr = _currFiscQtr - 1
    var _dayOfFiscalQtr = MAX( 'Calendar'[Day of Fiscal Quarter] )
    // likely need to errHndl cases where largest day in fiscal qtr doesn't line up right

    RETURN
    CALCULATE(
        SELECTEDMEASURE()
        , ALL( 'Calendar' )
        , 'Calendar'[Sequential Fiscal Quarter] = _prevFiscQtr
        , 'Calendar'[Day of Fiscal Quarter] <= _dayOfFiscalQtr
    )
RETURN
    IF (
        NOT ISBLANK ( _cQTD ) && NOT ISBLANK ( _pQTD ),
        DIVIDE( _cQTD - _pQTD , _pQTD )
    )
Last Month
LM = var _currOffset = MAX('Calendar'[Fiscal Month Offset])
var _offsetBegin = MIN('Calendar'[Fiscal Month Offset]) - 1
var _offsetEnd = _currOffset - 1
var _currYr = MAX('Calendar'[Fiscal Year Offset])
var _datesOffsetPd =
CALCULATETABLE(
    VALUES('Calendar'[Date]),
    ALL('Calendar'),
    'Calendar'[Fiscal Month Offset] >= _offsetBegin &&
    'Calendar'[Fiscal Month Offset] <= _offsetEnd
)
var _rslt =
CALCULATE(
    SELECTEDMEASURE(),
    'Calendar'[Date] IN _datesOffsetPd
)
RETURN
_rslt
Previous Period
PP =
// dynamic to fiscal month, quarter, year
var _monthsBack =
SWITCH(
    TRUE(),
    HASONEVALUE('Calendar'[Fiscal Month Offset]), 1,
    HASONEVALUE('Calendar'[Fiscal Quarter Offset]), 3,
    12
)
var _currOffset = MAX( 'Calendar'[Sequential Fiscal Month] )
var _offsetBegin = MIN( 'Calendar'[Sequential Fiscal Month] ) - _monthsBack
var _offsetEnd = _currOffset - _monthsBack
var _currYr = MAX( 'Calendar'[Fiscal Year Offset] )
var _datesOffsetPd =
CALCULATETABLE(
    VALUES( 'Calendar'[Date] )
    , ALL( 'Calendar' )
    , 'Calendar'[Sequential Fiscal Month] >= _offsetBegin &&
        'Calendar'[Sequential Fiscal Month] <= _offsetEnd
)
var _rslt =
CALCULATE (
    SELECTEDMEASURE(),
    'Calendar'[Date] IN _datesOffsetPd
)
RETURN
_rslt
Current vs Previous Period
CP vs PP =
// dynamic to fiscal month, quarter, year
var _monthsBack =
SWITCH(
    TRUE(),
    HASONEVALUE('Calendar'[Fiscal Month Offset]), 1,
    HASONEVALUE('Calendar'[Fiscal Quarter Offset]), 3,
    12
)
var _currOffset = MAX( 'Calendar'[Sequential Fiscal Month] )
var _offsetBegin = MIN( 'Calendar'[Sequential Fiscal Month] ) - _monthsBack
var _offsetEnd = _currOffset - _monthsBack
var _cy = MAX( 'Calendar'[Fiscal Year Offset] )
var _datesOffsetPd =
CALCULATETABLE(
    VALUES( 'Calendar'[Date] )
    , ALL( 'Calendar' )
    , 'Calendar'[Sequential Fiscal Month] >= _offsetBegin &&
        'Calendar'[Sequential Fiscal Month] <= _offsetEnd
)
var _rslt =
CALCULATE (
    SELECTEDMEASURE(),
    'Calendar'[Date] IN _datesOffsetPd
)
RETURN
SELECTEDMEASURE() - _rslt
Current vs Previous Period %
CP vs PP % =
// dynamic to fiscal month, quarter, year
var _monthsBack =
SWITCH(
    TRUE(),
    HASONEVALUE('Calendar'[Fiscal Month Offset]), 1,
    HASONEVALUE('Calendar'[Fiscal Quarter Offset]), 3,
    12
)
var _currOffset = MAX( 'Calendar'[Sequential Fiscal Month] )
var _offsetBegin = MIN( 'Calendar'[Sequential Fiscal Month] ) - _monthsBack
var _offsetEnd = _currOffset - _monthsBack
var _cy = MAX( 'Calendar'[Fiscal Year Offset] )
var _datesOffsetPd =
CALCULATETABLE(
    VALUES( 'Calendar'[Date] )
    , ALL( 'Calendar' )
    , 'Calendar'[Sequential Fiscal Month] >= _offsetBegin &&
        'Calendar'[Sequential Fiscal Month] <= _offsetEnd
)
var _rslt =
CALCULATE (
    SELECTEDMEASURE(),
    'Calendar'[Date] IN _datesOffsetPd
)
RETURN
DIVIDE( SELECTEDMEASURE() - _rslt, ABS(_rslt) )
Same Period Last Year
SPLY =
CALCULATE (
        SELECTEDMEASURE (),
        SAMEPERIODLASTYEAR ( 'Calendar'[Date] )
    )
Last Year Week
LYWeek = var _currOffset = MAX( Calendar[Fiscal Week Offset] )
VAR _weeksofyear = MAX(Calendar[Fiscal Weeks])
var _offsetBegin = MIN( Calendar[Fiscal Week Offset] ) - _weeksofyear
var _offsetEnd = _currOffset - _weeksofyear
var _currYr = MAX( 'Calendar'[Fiscal Year Offset] )
var _datesOffsetPd =
CALCULATETABLE(
    VALUES( 'Calendar'[Date] )
    , ALL( 'Calendar' )
    , 'Calendar'[Fiscal Week Offset] >= _offsetBegin &&
        'Calendar'[Fiscal Week Offset] <= _offsetEnd
)
var _rslt =
CALCULATE (
    SELECTEDMEASURE(),
    'Calendar'[Date] IN _datesOffsetPd
)
RETURN
_rslt
Example
Amount QTD =
Calculate( [measure],
KEEPFILTERS('z-CG Time Intelegence'[Time Intelligence Type] = 'QTD' ))
//Where Time Intelligence Type is a calculated group in Model View
Time Since Last Refresh
Let's create a blank query in power query editor and call it
zz-ReportRefresh.
Example
let

    Source = #table({"Dataset Refresh DT - UTC"},{{DateTimeZone.FixedUtcNow()}}),

    #"Changed Type" = Table.TransformColumnTypes(Source,{{"Dataset Refresh DT - UTC", type datetimezone}}),

    #"Inserted Local Time" = Table.AddColumn(#"Changed Type", "Dataset Refresh DT - EST", each DateTimeZone.SwitchZone([#"Dataset Refresh DT - UTC"],-4), type datetimezone)

in

    #"Inserted Local Time"
Let's create a measure and call it Time Since Last Refresh to inform the Power BI user as in Figure 1.
Time Since Last Refresh =
var _currTm = UTCNOW()

var _refreshTm = MAX( 'zz-ReportRefresh'[Dataset Refresh DT - UTC] )

var _delta = ROUNDDOWN ( DATEDIFF(_refreshTm, _currTm, MINUTE ) / 60 , 0 )

var _isMultiple = _delta > 1

var _is0 = _delta = 0

return


SWITCH(

    TRUE(),

    _isMultiple, FORMAT( _delta, "0" ) & " hours since last dataset refresh",

    NOT _is0, FORMAT( _delta, "0") & " hour since last dataset refresh",

    _is0, "Dataset refreshed in the past hour"

)
The Last Date by Each Group
Let's create a blank query in power query editor and set the Source
from existing query, in this case,
Source = Inventory_wo_rank. As a second step, we should
remove the all the unnecessary columns #"Removed Columns"
and remove all the duplicates #"Removed Duplicates".
Example
let

    Source = Inventory_wo_rank,
    #"Removed Columns" = Table.RemoveColumns(Source ,{"Fiscal Week Desc", "Super Region", "Region", "Country Name", "Plant & Name", "CFN",
    "Material", "Fiscal Year", "Fiscal Week Num", "Month", "Day",  "Curreny", "FY24 AOP", "FY25 AOP"}),

    #"Removed Duplicates" = Table.Distinct(#"Removed Columns"),
    #"Grouped Rows" = Table.Group(#"Removed Duplicates", {"Source"}, {{"All", each _, type table [Source=nullable text, FYandFW0num=nullable number]}}),
    Custom1 = Table.TransformColumns( #"Grouped Rows", {{"All", each  Table.AddRankColumn( _, "rank", {{"FYandFW0num", Order.Descending}} )}}),
    #"Expanded All" = Table.ExpandTableColumn(Custom1, "All", {"FYandFW0num", "rank"}, {"FYandFW0num", "rank"}),
    #"Changed Type1" = Table.TransformColumnTypes(#"Expanded All",{ {"Source", type text}, {"FYandFW0num", Int64.Type}, {"rank", Int64.Type}})
in
     #"Changed Type1"
In Power Query we expect to see, at this point, similar to table below.
\[\begin{array}{|l|c|} \hline \text{Source} & \text{FYandFW0num} \\ \hline Group A & \text{202448} \\ Group A & \text{202451} \\ Group B & \text{202501} \\ Group B & \text{202452} \\ Group B & \text{202453} \\ Group C & \text{202452} \\ \hline \end{array}\] #"Grouped Rows" = Table.Group(#"Removed Duplicates", {"Source"}, {{"All", each _, type table [Source=nullable text, FYandFW0num=nullable number]}}),
Custom1 = Table.TransformColumns( #"Grouped Rows", {{"All", each Table.AddRankColumn( _, "Rank", {{"FYandFW0num", Order.Descending}} )}}),
#"Expanded All" = Table.ExpandTableColumn(Custom1, "All", {"FYandFW0num", "Rank"}, {"FYandFW0num", "Rank"}),
#"Changed Type1" = Table.TransformColumnTypes(#"Expanded All",{ {"Source", type text}, {"FYandFW0num", Int64.Type}, {"Rank", Int64.Type}})
in
#"Changed Type1"
Finally, we get the ranking within each Group.
\[\begin{array}{|l|c|c|} \hline \text{Source} & \text{FYandFW0num} & \text{Rank} \\ \hline Group A & \text{202448} & \text{2} \\ Group A & \text{202451} & \text{1} \\ Group B & \text{202501} & \text{1} \\ Group B & \text{202452} & \text{2} \\ Group B & \text{202453} & \text{3} \\ Group C & \text{202452} & \text{1} \\ \hline \end{array}\]Current week
\[\begin{array}{|l|c|} \hline \text{FYandFW0num} & \text{Rank} \\ \hline \text{202448} & \text{1} \\ \text{202451} & \text{2} \\ \text{202452} & \text{3} \\ \text{202453} & \text{4} \\ \text{202501} & \text{5} \\ \hline \end{array}\]CW Amt =
VAR CurrentFiscalWeek = MAX( 'Inventory'[FYandFW0num] )
RETURN
CALCULATE( [Inventory],
'Inventory'[FYandFW0num] = CurrentFiscalWeek )
PW Amt =
CALCULATE( [Inventory],
KEEPFILTERS( 'Inventory'[toRank2.Rank] = MIN('Inventory'[toRank2.Rank]) )
The Last Two Weeks Change
Example
Let's set the data model first. If the dates would be
FY24 WK52 then we should have rank the given format and use
the same methodology below.
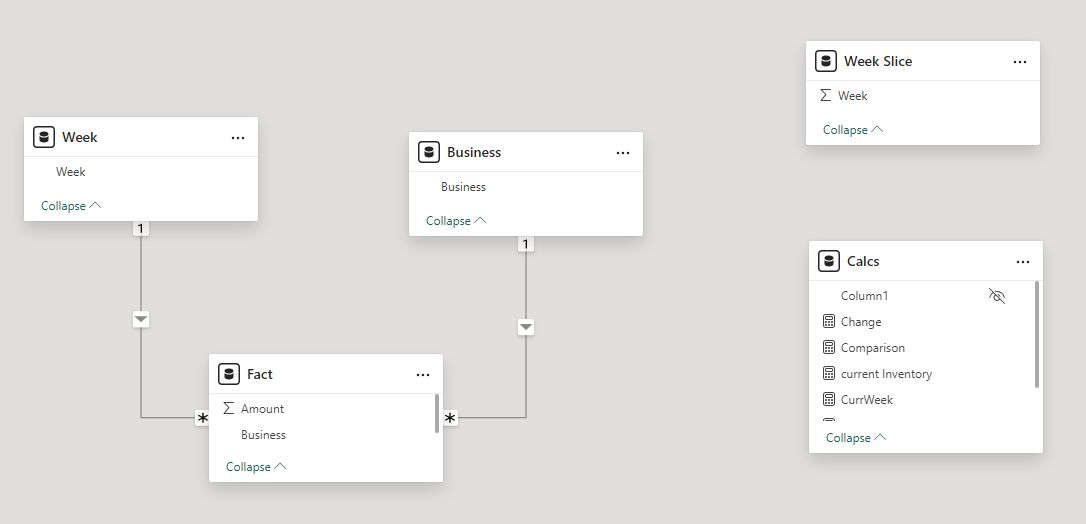
CurrWeek =
VAR TAB =
    TOPN(
        2,
        'Week Slice',
        'Week Slice'[Week],
        DESC
    )
VAR _MAX = MAXX(TAB, 'Week Slice'[Week])
RETURN
_MAX
PrevWeek =
VAR TAB =
TOPN(
2,
'Week Slice',
'Week Slice'[Week],
DESC
)
VAR _MIN = MINX(TAB, 'Week Slice'[Week])
RETURN
_MINcurrent Inventory =
VAR _MAX = VALUE([CurrWeek])
VAR TotalCW =
CALCULATE(
[Total],
ALL(Week),
Week[Week] = _MAX
)
RETURN
TotalCWTotal = sum('Fact'[Amount])Change =
VAR _MAX = VALUE([CurrWeek])
VAR _MIN = VALUE([PrevWeek])
VAR TotalCW =
CALCULATE(
[Total],
ALL(Week),
Week[Week] = _MAX
)
VAR TotalPW =
CALCULATE(
[Total],
ALL(Week),
Week[Week] = _MIN
)
VAR Final =
TotalCW - TotalPW
RETURN
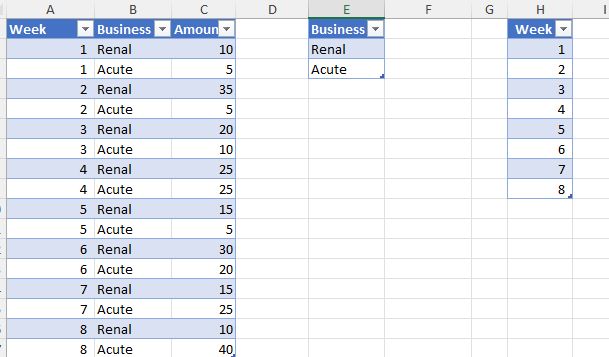
FinalComparison = "Change from week "&[PrevWeek] &" to "&[CurrWeek]Viz Ideas
New Parameter
Let's create new parameters for Hierarch,
Measure, and Time to have multiple drop down
options into the viz.
Table Hierarch = {
    ("Business Unit", NAMEOF('dimProduct'[BusinessUnit]), 0),
    ("Business Sub Unit", NAMEOF('dimProduc'[BusinessSubUnit]), 1),
    ("Product Group", NAMEOF('dimProduct'[ProductGroup]), 2),
    ("Product Code", NAMEOF('dimProduct'[ProductCode]), 3),
    ("Global Area", NAMEOF('dimReporting'[GlobalArea]), 4),
    ("Geography", NAMEOF('dimReporting'[Geography]), 5),
    ("Country", NAMEOF('dimReporting'[Country]), 6)
}
Measure = {
("Revenue", NAMEOF('Calculation'[Revenue]), 0),
("LY Revenue", NAMEOF('Calculation'[LYRevenue]), 1),
("AOP", NAMEOF('Calculation'[AOP]), 2),
("Revenue vs AOP", NAMEOF('Calculation'[RevenuevsAOP]), 3)
}Fiscal Timeline = {
("Year", NAMEOF('Calendar'[Fiscal YR]), 0),
("Quarter", NAMEOF('Calendar'[Fiscal Quarter-Year]), 1),
("Month", NAMEOF('Calendar'[FY Month]), 2),
("Week", NAMEOF('Calendar'[Fiscal Week]), 3)
}The new parameters help to create the table with ease and provides more filtering option.
Figure 1
Book Marks Example
Tool Tips Example
RLS
Following link may give an idea of how to set up RLS. Yet, I will show you a better way.
Fact_RLS
Fact_RLS dataflow as:
From the Modeling tab, select Manage Roles and add a new role as
follow. For ADMIN role set up NO FILTER.
Keep in mine, the Fact_RLS dataflow has no relationship
with other tables in the data modelling. Yet dimReporting
has relationship with other tables. For other Roles set up the filter as
follows;
BUSINESS PARTNER
[Finance Business Partner] #A column name in the Selected Table (let's assume it is dimReporting table)
    IN CALCULATETABLE (
        VALUES ( 'Fact_RLS'[User] ),
                 'Fact_RLS'[Email Address]
        = USERNAME ()
    )
FINANCIAL ANALYST
[Analyst] #A column name in the Selected Table (let's assume it is dimReporting table)
    IN CALCULATETABLE (
        VALUES ( 'Fact_RLS'[User] ),
                 'Fact_RLS'[Email Address]
        = USERNAME ()
    )
RPT ID
[Reporting Location ID] #A column name in the Selected Table (let's assume it is dimReporting table)
    IN CALCULATETABLE (
        VALUES ( 'Fact_RLS'[RPT ID] ),
                 'Fact_RLS'[Email Address]
        = USERNAME ()
    )
SENIOR LEADERSHIP
[Senior Leadership Team] #A column name in the Selected Table (let's assume it is dimReporting table)
    IN CALCULATETABLE (
        VALUES ( Fact_RLS[User] ),
                 Fact_RLS[Email Address]
        = USERNAME ()
    )
Fact FX
To be able to produce before Fact FX data flow we need
to create a few data flows.
let

    Source = let
      Source = Excel.Workbook(File.Contents(".\dimFX.xlsx"), null, true),
    dimFX_Table = Source{[Item="dimFX",Kind="Table"]}[Data],
    #"Changed Type" = Table.TransformColumnTypes(dimFX_Table,{{"Currency Code", type text}, {"Country", type text}, {"Currency Conversion Method", type text}, {"FY23 AOP", type number}, {"FY24 AOP", type number}, {"FY25 AOP", type number},
    {"FY23 May M-BS", type number}, {"FY23 Jun M-BS", type number}, {"FY23 Jul M-BS", type number}, {"FY23 Aug M-BS", type number}, {"FY23 Sep M-BS", type number}, {"FY23 Oct M-BS", type number}, {"FY23 Nov M-BS", type number},
    {"FY23 Dec M-BS", type number}, {"FY23 Jan M-BS", type number}, {"FY23 Feb M-BS", type number}, {"FY23 Mar M-BS", type number}, {"FY23 Apr M-BS", type number}, {"FY23 May M-PL", type number}, {"FY23 Jun M-PL", type number},
     {"FY23 Jul M-PL", type number}, {"FY23 Aug M-PL", type number}, {"FY23 Sep M-PL", type number}, {"FY23 Oct M-PL", type number}, {"FY23 Nov M-PL", type number}, {"FY23 Dec M-PL", type number}, {"FY23 Jan M-PL", type number},
     {"FY23 Feb M-PL", type number}, {"FY23 Mar M-PL", type number}, {"FY23 Apr M-PL", type number}, {"FY24 May M-BS", type number}, {"FY24 Jun M-BS", type number}, {"FY24 Jul M-BS", type number}, {"FY24 Aug M-BS", type number},
      {"FY24 Sep M-BS", type number}, {"FY24 Oct M-BS", type number}, {"FY24 Nov M-BS", type number}, {"FY24 Dec M-BS", type number}, {"FY24 Jan M-BS", type number}, {"FY24 Feb M-BS", type number}, {"FY24 Mar M-BS", type number},
      {"FY24 Apr M-BS", type number}, {"FY25 May M-BS", type number}, {"FY25 Jun M-BS", type number}, {"FY25 Jul M-BS", type number}, {"FY25 Aug M-BS", type number}, {"FY25 Sep M-BS", type number}, {"FY25 Oct M-BS", type number},
      {"FY25 Nov M-BS", type number}, {"FY25 Dec M-BS", type number}, {"FY25 Jan M-BS", type number}, {"FY25 Feb M-BS", type number}, {"FY25 Mar M-BS", type number}, {"FY25 Apr M-BS", type any}, {"FY24 May M-PL", type number},
       {"FY24 Jun M-PL", type number}, {"FY24 Jul M-PL", type number}, {"FY24 Aug M-PL", type number}, {"FY24 Sep M-PL", type number}, {"FY24 Oct M-PL", type number}, {"FY24 Nov M-PL", type number}, {"FY24 Dec M-PL", type number},
       {"FY24 Jan M-PL", type number}, {"FY24 Feb M-PL", type number}, {"FY24 Mar M-PL", type number}, {"FY24 Apr M-PL", type number}, {"FY25 May M-PL", type number}, {"FY25 Jun M-PL", type number}, {"FY25 Jul M-PL", type number},
       {"FY25 Aug M-PL", type number}, {"FY25 Sep M-PL", type number}, {"FY25 Oct M-PL", type number}, {"FY25 Nov M-PL", type number}, {"FY25 Dec M-PL", type number}, {"FY25 Jan M-PL", type number}, {"FY25 Feb M-PL", type number},
       {"FY25 Mar M-PL", type number}, {"FY25 Apr M-PL", type number}})

in
    #"Changed Type",
    #"Removed Duplicates" = Table.Distinct(Source, {"Currency Code", "Country", "Currency Conversion Method"}),
  #"Removed columns" = Table.RemoveColumns(#"Removed Duplicates", {"FY23 AOP", "FY24 AOP"}),
  #"Duplicated column 3" = Table.DuplicateColumn(#"Removed columns", "FY25 AOP", "FY24 AOP"),
  #"Duplicated column" = Table.DuplicateColumn(#"Duplicated column 3", "FY25 AOP", "FY23 AOP"),
  #"Duplicated column 1" = Table.DuplicateColumn(#"Duplicated column", "FY25 AOP", "FY22 AOP"),
  #"Duplicated column 2" = Table.DuplicateColumn(#"Duplicated column 1", "FY22 AOP", "FY21 AOP"),
    UnpivotFXRate = Table.UnpivotOtherColumns(#"Duplicated column 2", {"Currency Conversion Method", "Country", "Currency Code"}, "Attribute", "FX Rate"),
    AddFXScenario = Table.AddColumn(UnpivotFXRate, "FX Scenario", each if Text.Contains([Attribute], "AOP") then "AOP" else "Actual", type text),
    #"Inserted Text After Delimiter" = Table.AddColumn(AddFXScenario, "FX Type", each if Text.Contains([Attribute],"AOP") then "AOP" else Text.AfterDelimiter([Attribute], "-"), type text),
    #"Inserted Text Before Delimiter" = Table.AddColumn(#"Inserted Text After Delimiter", "Date_Stg", each if Text.Contains([Attribute],"AOP") then Text.BeforeDelimiter([Attribute], "AOP") & "May" else Text.BeforeDelimiter([Attribute], " M-"), type text),
    #"Extracted Text After Delimiter" = Table.TransformColumns(#"Inserted Text Before Delimiter", {{"Date_Stg", each Text.AfterDelimiter(_, "FY"), type text}}),
    #"Added Custom1" = Table.AddColumn(#"Extracted Text After Delimiter", "Date_Stg2", each "15-" & Text.End([Date_Stg],3) & "-" & Text.Start([Date_Stg],2)),
    #"Changed Type" = Table.TransformColumnTypes(#"Added Custom1",{{"Date_Stg2", type date}}),
    #"Added Custom2" = Table.AddColumn(#"Changed Type", "Date", each if Text.Contains([Attribute], "AOP")
then List.Generate(()=>[x=Date.AddYears( [Date_Stg2], -1 ),i=0], each [i]<12, each [i=[i]+1,x=Date.AddMonths([x],1)], each [x]) // creates 12 months of AOP data
else if Date.Month([Date_Stg2]) > 4
then List.Dates(Date.AddYears( [Date_Stg2], -1 ),1,#duration(1,0,0,0)) // one item list, transposing year back by 1
else List.Dates([Date_Stg2],1,#duration(1,0,0,0))) // one item list
,
    #"Expanded Date" = Table.ExpandListColumn(#"Added Custom2", "Date"),
    #"Changed Type1" = Table.TransformColumnTypes(#"Expanded Date",{{"Date", type date}}),
    #"Merged Queries" = Table.NestedJoin(#"Changed Type1", {"Date"}, #"Fiscal Date", {"Date"}, "Fiscal Date", JoinKind.LeftOuter),
    #"Expanded Fiscal Date" = Table.ExpandTableColumn(#"Merged Queries", "Fiscal Date", {"Fiscal Month Start", "Fiscal Month End"}, {"Fiscal Month Start", "Fiscal Month End"}),
    #"Added Custom" = Table.AddColumn(#"Expanded Fiscal Date", "Fiscal Date", each {Number.From([Fiscal Month Start])..Number.From([Fiscal Month End])}),
    #"Expanded Custom" = Table.ExpandListColumn(#"Added Custom", "Fiscal Date"),
    #"Changed Type2" = Table.TransformColumnTypes(#"Expanded Custom",{{"FX Rate", type number}, {"Fiscal Date", type date}}),
    #"Removed Columns1" = Table.RemoveColumns(#"Changed Type2",{"Date", "Fiscal Month Start", "Fiscal Month End", "Date_Stg", "Date_Stg2"}),
    #"Renamed Columns" = Table.RenameColumns(#"Removed Columns1",{{"Fiscal Date", "Date"}})
in
    #"Renamed Columns"
Fiscal Month End
let
  Source = dimCalendar,
  #"Removed Duplicates" = Table.Distinct(Source, {"Fiscal Year"}),
  #"Choose columns" = Table.SelectColumns(#"Removed Duplicates", {"Fiscal Year", "Fiscal Month 01 End", "Fiscal Month 02 End", "Fiscal Month 03 End", "Fiscal Month 04 End", "Fiscal Month 05 End", "Fiscal Month 06 End", "Fiscal Month 07 End", "Fiscal Month 08 End", "Fiscal Month 09 End", "Fiscal Month 10 End", "Fiscal Month 11 End", "Fiscal Month 12 End"}),
  #"Unpivoted Columns3" = Table.UnpivotOtherColumns(#"Choose columns", {"Fiscal Year"}, "Attribute", "Value"),
  #"Renamed Columns" = Table.RenameColumns(#"Unpivoted Columns3", {{"Value", "Fiscal Month End"}}),
  #"Added Conditional Column" = Table.AddColumn(#"Renamed Columns", "Fiscal Month", each if [Attribute] = "Fiscal Month 01 End" then "May" else if [Attribute] = "Fiscal Month 02 End" then "Jun" else if [Attribute] = "Fiscal Month 03 End" then "Jul" else if [Attribute] = "Fiscal Month 04 End" then "Aug" else if [Attribute] = "Fiscal Month 05 End" then "Sep" else if [Attribute] = "Fiscal Month 06 End" then "Oct" else if [Attribute] = "Fiscal Month 07 End" then "Nov" else if [Attribute] = "Fiscal Month 08 End" then "Dec" else if [Attribute] = "Fiscal Month 09 End" then "Jan" else if [Attribute] = "Fiscal Month 10 End" then "Feb" else if [Attribute] = "Fiscal Month 11 End" then "Mar" else if [Attribute] = "Fiscal Month 12 End" then "Apr" else null),
  #"Inserted Merged Column" = Table.AddColumn(#"Added Conditional Column", "Fiscal Month Year", each Text.Combine({[Fiscal Month], [Fiscal Year]}, "-"), type text),
  #"Removed Columns" = Table.RemoveColumns(#"Inserted Merged Column", {"Attribute"}),
  #"Transform columns" = Table.TransformColumnTypes(#"Removed Columns", {{"Fiscal Month", type text}}),
  #"Replace errors" = Table.ReplaceErrorValues(#"Transform columns", {{"Fiscal Month", null}})
in
  #"Replace errors"
Fiscal Month Start
let
  Source = dimCalendar,
  #"Removed Duplicates" = Table.Distinct(Source, {"Fiscal Year"}),
    #"Choose columns" = Table.SelectColumns(#"Removed Duplicates",{"Fiscal Year Start", "Fiscal Year", "Fiscal Month 01 End", "Fiscal Month 02 End", "Fiscal Month 03 End", "Fiscal Month 04 End", "Fiscal Month 05 End", "Fiscal Month 06 End", "Fiscal Month 07 End", "Fiscal Month 08 End", "Fiscal Month 09 End", "Fiscal Month 10 End", "Fiscal Month 11 End"}),
    #"Unpivoted Columns3" = Table.UnpivotOtherColumns(#"Choose columns", {"Fiscal Year"}, "Attribute", "Value"),
    #"Changed Type" = Table.TransformColumnTypes(#"Unpivoted Columns3",{{"Value", Int64.Type}}),
    #"Added Conditional Column1" = Table.AddColumn(#"Changed Type", "Fiscal Month Start", each if [Attribute] = "Fiscal Year Start" then [Value] else [Value]+1),
    #"Added Conditional Column" = Table.AddColumn(#"Added Conditional Column1", "Fiscal Month", each if [Attribute] = "Fiscal Month 01 End" then "Jun" else if [Attribute] = "Fiscal Month 02 End" then "Jul" else if [Attribute] = "Fiscal Month 03 End" then "Aug" else if [Attribute] = "Fiscal Month 04 End" then "Sep" else if [Attribute] = "Fiscal Month 05 End" then "Oct" else if [Attribute] = "Fiscal Month 06 End" then "Nov" else if [Attribute] = "Fiscal Month 07 End" then "Dec" else if [Attribute] = "Fiscal Month 08 End" then "Jan" else if [Attribute] = "Fiscal Month 09 End" then "Feb" else if [Attribute] = "Fiscal Month 10 End" then "Mar" else if [Attribute] = "Fiscal Month 11 End" then "Apr" else if [Attribute] = "Fiscal Year Start" then "May" else null),
    #"Inserted Merged Column" = Table.AddColumn(#"Added Conditional Column", "Fiscal Month Year", each Text.Combine({[#"Fiscal Month"], [Fiscal Year]}, "-"), type text),
    #"Removed Columns1" = Table.RemoveColumns(#"Inserted Merged Column",{"Attribute", "Value"}),
    #"Changed Type1" = Table.TransformColumnTypes(#"Removed Columns1",{{"Fiscal Month Start", type date}, {"Fiscal Month", type text}})
in
    #"Changed Type1"
Fiscal Date
let
  Source = Table.NestedJoin(#"Fiscal Month End", {"Fiscal Month Year"}, #"Fiscal Month Start", {"Fiscal Month Year"}, "Fiscal Month Start", JoinKind.LeftOuter),
  #"Expanded Fiscal Month Start" = Table.ExpandTableColumn(Source, "Fiscal Month Start", {"Fiscal Month Start"}, {"Fiscal Month Start"}),
  #"Merged Queries" = Table.NestedJoin(#"Expanded Fiscal Month Start", {"Fiscal Month Year"}, Calendar, {"Fiscal Month-Year"}, "Calendar", JoinKind.LeftOuter),
  #"Expanded Calendar" = Table.ExpandTableColumn(#"Merged Queries", "Calendar", {"Date"}, {"Date"}),
  #"Transform columns" = Table.TransformColumnTypes(#"Expanded Calendar", {{"Fiscal Month", type text}}),
  #"Replace errors" = Table.ReplaceErrorValues(#"Transform columns", {{"Fiscal Month", null}})
in
  #"Replace errors"
Currency Rate Conversion
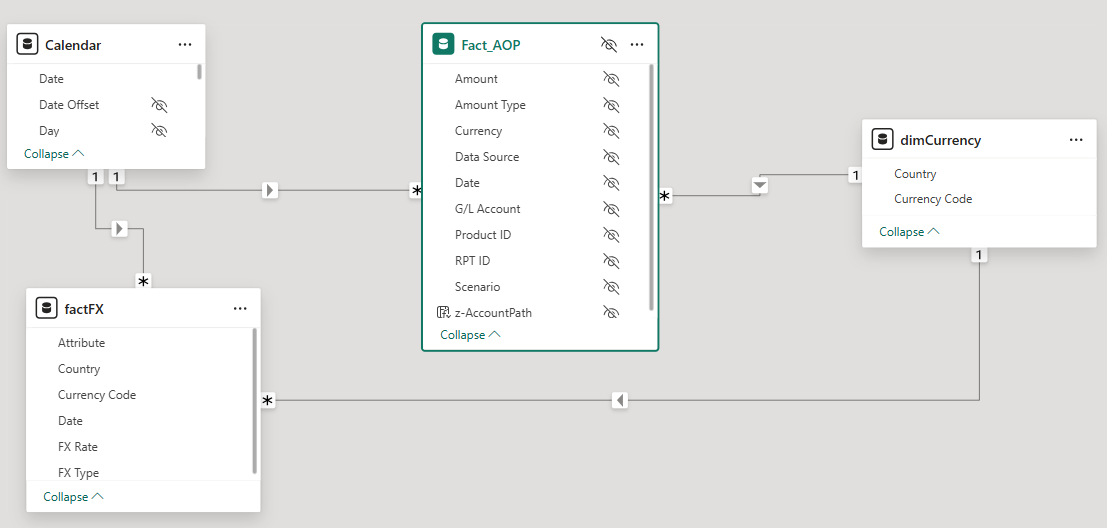
Fact FX
Fact FX dataflow as:
dimCurrency
dimCurrency data flow as:
Fact_AOP
Fact_AOP data flow as:
USD Currency Conversion
Base Measure = SUM('Fact_AOP'[Amount])


Sum@AOP =
VAR _AggregatedAmountInCurrency =
    ADDCOLUMNS (
        SUMMARIZE (
            'Fact_AOP',
            'Calendar'[Date],
            'dimCurrency'[Currency Code]
        ),
        "@AmountInCurrency", [Base Measure],
        "@Rate", CALCULATE(
                    MAX( 'factFX'[FX Rate] ),
                    KEEPFILTERS( 'factFX'[FX Type] = "AOP" ),
                    ALLEXCEPT('Calendar', 'Calendar'[Date])
                )
    )
VAR _Result =
    SUMX (
        _AggregatedAmountInCurrency,
        [@AmountInCurrency] * COALESCE( [@Rate], IF( 'dimCurrency'[Currency Code] = "USD" , 1) )
    )
RETURN
    _Result
Data Modeling
First, let's learn what not to do!
- Don't overload your model.
- Don't use the same semantic model.
- Don't keep in the report unused DAX and tables.
Let's learn what to do!
- Create a Power BI template where you can have the min necessary tables (dimCalander, dimCurrency, FactFX, etc.) and DAX measures (Last time to Refresh, Personal Greetings Login Name, Time Intelligence, etc.).
- Build smaller Power BI reports.
- Create each time a new semantic model.
- Avoid using Direct Query or Lived Connection.
Bridge Table
Bridge tables are used to remove multi-multi relationship.
Data Source
This calculated table appends the multiple fact tables.
Data Sources =
var _base =
SUMMARIZE(
    UNION(
        SUMMARIZE(
            SELECTCOLUMNS( 'Fact_Financials', "Data Source", 'Fact_Financials'[Data Source] ),
            [Data Source]
        )
        , // copy paste this pattern when adding new fact tables as they appear
        SUMMARIZE( // SNOWFLAKE GL_DTL carries transactional data from Snowflake
            SELECTCOLUMNS( 'Fact_AOP', "Data Source", 'Fact_AOP'[Data Source] ),
            [Data Source]
        )

    )
    , [Data Source]//, [Scenarios]
)
var _addCategories =
    ADDCOLUMNS(
        _base
        , "Input or Backend"
        , SWITCH(
            TRUE(),
            CONTAINSSTRING( [Data Source], "Input" ), "Input",
            CONTAINSSTRING( [Data Source], ".xlsx" ), "Input",
            CONTAINSSTRING( [Data Source], "CMR" ), "Input",
            CONTAINSSTRING( [Data Source], "BW_Inventory" ), "Input",
            CONTAINSSTRING( [Data Source], "Corporate S4 Reconciliation Input" ), "Input",
            CONTAINSSTRING( [Data Source], "Greater China S4 Revenue Adj" ), "Input",
            CONTAINSSTRING( [Data Source], "Americas S4 Revenue Adj" ), "Input",
            CONTAINSSTRING( [Data Source], "EMEA S4 Revenue Adj" ), "Input",
            CONTAINSSTRING( [Data Source], "SNOWFLAKE" ), "Snowflake",
            CONTAINSSTRING( [Data Source], "SAP" ), "SAP S4",
            CONTAINSSTRING( [Data Source], "S4" ), "SAP S4",
            CONTAINSSTRING( [Data Source], "Freight Review" ), "Freight",
            CONTAINSSTRING( [Data Source], "Market Model" ), "SAP S4",
            "Input"
        )
        , "Data Source Category"
        , SWITCH(
            TRUE(),
            CONTAINSSTRING( [Data Source], "SGM" ), "SGM",
            CONTAINSSTRING( [Data Source], "GL_DTL" ), "Weekly Sales", // may modify this
            CONTAINSSTRING( [Data Source], "GL_PCA" ), "Balance Sheet",
            CONTAINSSTRING( [Data Source], "Corporate S4 Reconciliation Input" ), "Weekly Sales",
            CONTAINSSTRING( [Data Source], "Greater China S4 Revenue Adj" ), "Weekly Sales",
            CONTAINSSTRING( [Data Source], "Americas S4 Revenue Adj" ),"Weekly Sales",
            CONTAINSSTRING( [Data Source], "EMEA S4 Revenue Adj" ), "Weekly Sales",
            CONTAINSSTRING( [Data Source], "SAP" ), "SAP",
            CONTAINSSTRING( [Data Source], "S4" ), "SAP",
            CONTAINSSTRING( [Data Source], "Freight Review" ), "Freight",
            CONTAINSSTRING( [Data Source], "Market Model" ), "Market Model",
            CONTAINSSTRING( [Data Source], "P-CODE" ), "P-Code",
            CONTAINSSTRING( [Data Source], "CMR" ), "CMR",
            CONTAINSSTRING( [Data Source], "SPEND BY COST CENTER" ), "CMR",
            CONTAINSSTRING( [Data Source], "Target" ), "Targets",
            CONTAINSSTRING( [Data Source], "CAPEX" ), "CAPEX",
            CONTAINSSTRING( [Data Source], "Weekly Sales" ), "Weekly Sales",
            CONTAINSSTRING( [Data Source], "WORKFORCE" ), "Workforce",
            CONTAINSSTRING( [Data Source], "OPC" ), "OPC",
            CONTAINSSTRING( [Data Source], "OTHER EXPENSE" ), "Other Expense",
            CONTAINSSTRING( [Data Source], "Input" ), "Input - Other",
            CONTAINSSTRING( [Data Source], "BW_Inventory" ), "BW Inventory",
            CONTAINSSTRING( [Data Source], ".xlsx" ), "Input - Other",

            "Other"
        )
    )
var _addSourceFacts =
    ADDCOLUMNS(
        _addCategories
        , "Data Source Fact"
        , SWITCH(
            TRUE(),
            // Snowflake and SAP S4
            CONTAINSSTRING( [Data Source], "GL_DTL" ), "Weekly Sales",
            CONTAINSSTRING( [Data Source], "GL_PCA" ), "Balance Sheet",
            CONTAINSSTRING( [Data Source], "SAP" ), "Weekly Sales",
            // INPUT SHEETS
            CONTAINSSTRING( [Data Source], "CMR BS" ), "Balance Sheet",
            CONTAINSSTRING( [Data Source], "CMR IS" ), "Income Statement",
            CONTAINSSTRING( [Data Source], "CMR PL" ), "Profit & Loss",
            CONTAINSSTRING( [Data Source], "CMR COGS" ), "COGS",

            [Data Source Category]
        )
    )
RETURN _addSourceFacts
Greeting the User
Let's create a measure to greet the Power BI user as in Figure 1.
Logged In User Name =
VAR _user_name =
        LOOKUPVALUE (
            'Fact_RLS'[User],
            Fact_RLS[Email Address], USERPRINCIPALNAME ()
        )
RETURN
    "Hi!, " & IF (
        LEN ( _user_name ) > 20,
        LEFT (_user_name, 17) & "...",
        _user_name
    )